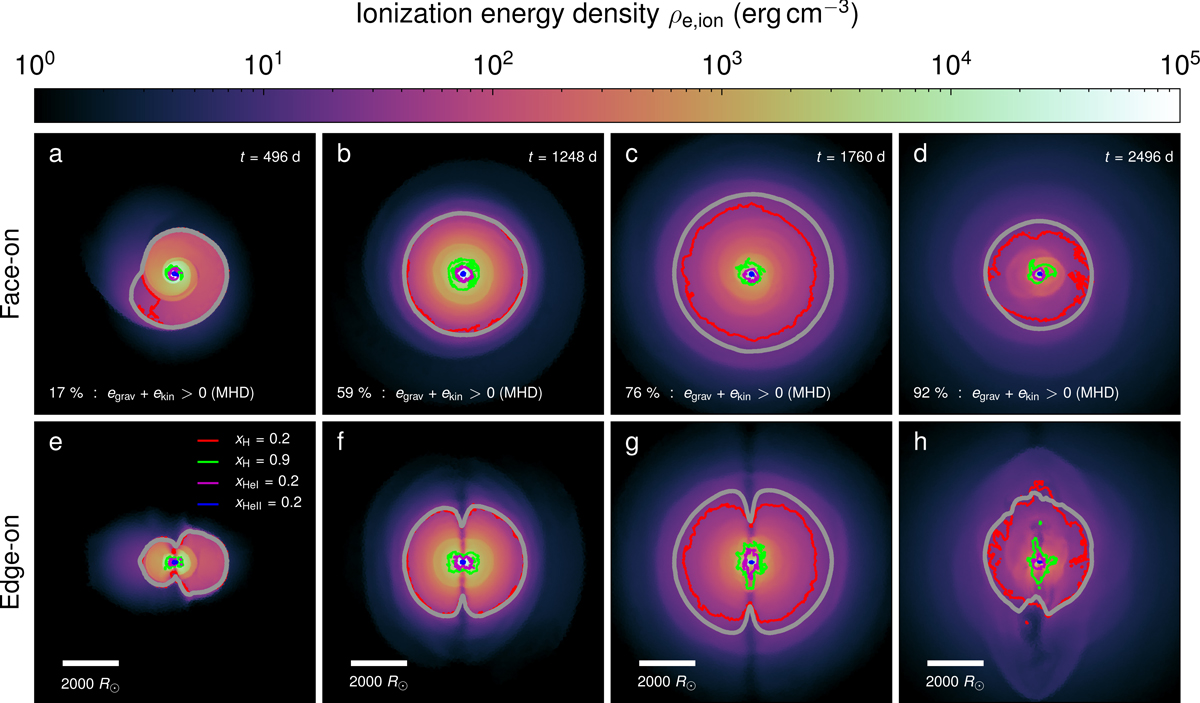
Fig. B.1.

Download original image
Ionization-energy density in the reference simulation. The ionization-energy density, ρe, ion, is shown at four different times in the orbital plane (top panels, a–d) and perpendicular to the orbital plane (bottom panels, e–h). The gray contours indicate the approximate position of the photosphere at a given time. As marked in the legend of panel (e), the red and green contours enclose a region where the number fraction of ionized hydrogen is between 0.2 and 0.9 and thus illustrate the region where hydrogen recombines. The purple and blue contours correspond to HeI and HeII number fractions of 0.2, i.e., helium recombines within these layers, close to the center of the expanding envelope. In panels (a)–(d), the current, unbound mass fractions as measured by the kinetic criterion are given (cf. Fig. 2).
Current usage metrics show cumulative count of Article Views (full-text article views including HTML views, PDF and ePub downloads, according to the available data) and Abstracts Views on Vision4Press platform.
Data correspond to usage on the plateform after 2015. The current usage metrics is available 48-96 hours after online publication and is updated daily on week days.
Initial download of the metrics may take a while.


