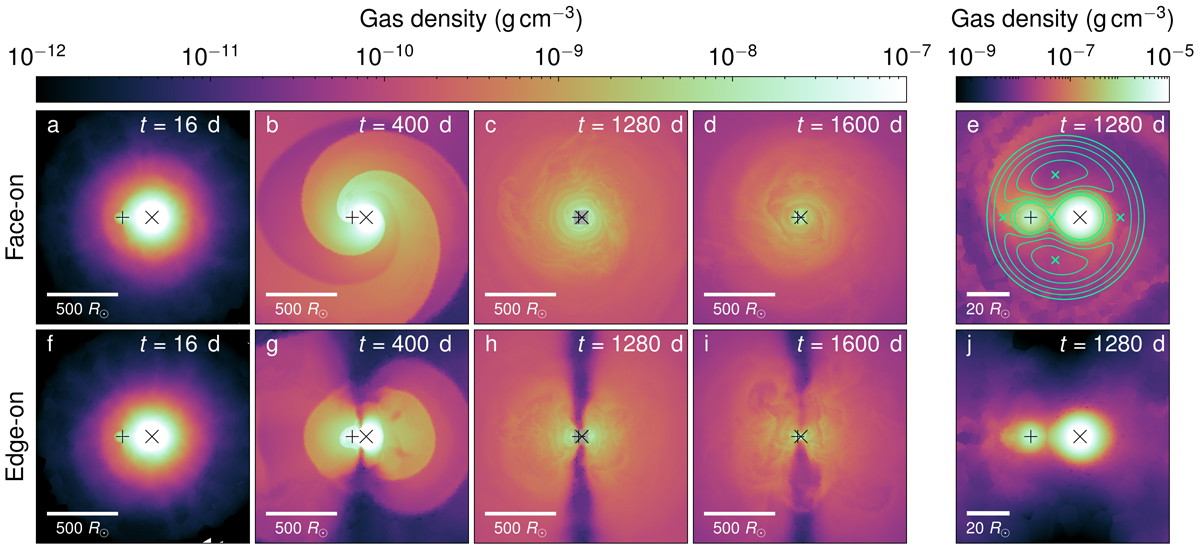
Fig. 1.
Download original image
Density evolution during the CE phase in our reference simulation. The panels are slices of gas density in the face-on view (top row) and edge-on view (bottom row). The cross symbol indicates the position of the core of the giant star and the plus symbol that of the companion. Panels e, j: zoomed-in views of the central region indicated by the gray boxes in panels c and h, respectively. The actual simulation domain is much larger than the panels shown here. Roche equipotential lines and the positions of the Lagrange points are added in panel e.
Current usage metrics show cumulative count of Article Views (full-text article views including HTML views, PDF and ePub downloads, according to the available data) and Abstracts Views on Vision4Press platform.
Data correspond to usage on the plateform after 2015. The current usage metrics is available 48-96 hours after online publication and is updated daily on week days.
Initial download of the metrics may take a while.