Fig. 1.
Download original image
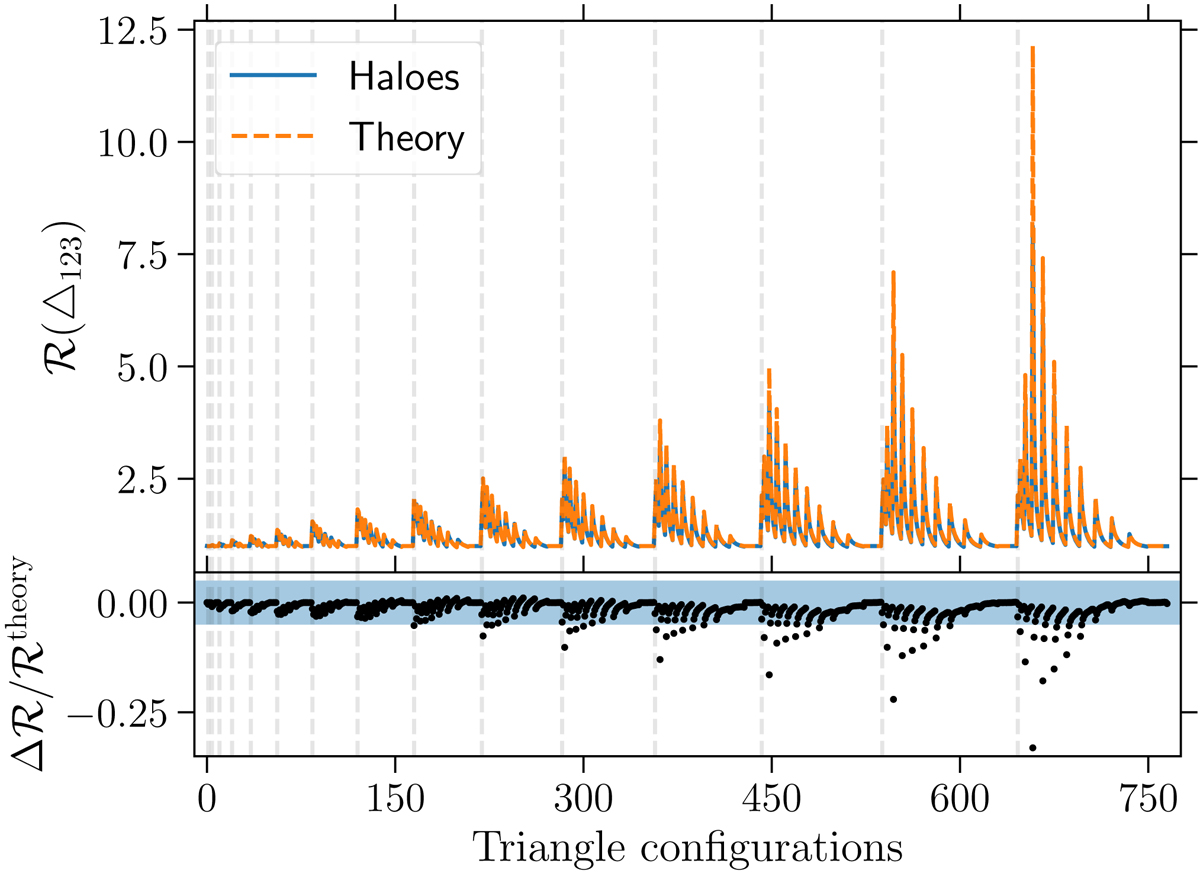
Comparison of theoretical prediction (orange dashed line) for ℛ(△123) using perturbation theory at LO against the direct measurement (blue solid line) from the halo catalogs of the Quijote suite of simulation is shown in the top panel. While the residual showing the deviation of the theoretical prediction from the direct measurement from the simulations is shown in the bottom panel. The blue shaded region denotes the 5% region. The triangle configuration go from the smallest being {(40, 45),(40, 45),(40, 45)} h−1 Mpc to the largest which corresponds to {(115, 120),(115, 120),(115, 120)} h−1 Mpc. The vertical dashed lines correspond to a change (increase) in the value of r12 bin in △123.
Current usage metrics show cumulative count of Article Views (full-text article views including HTML views, PDF and ePub downloads, according to the available data) and Abstracts Views on Vision4Press platform.
Data correspond to usage on the plateform after 2015. The current usage metrics is available 48-96 hours after online publication and is updated daily on week days.
Initial download of the metrics may take a while.