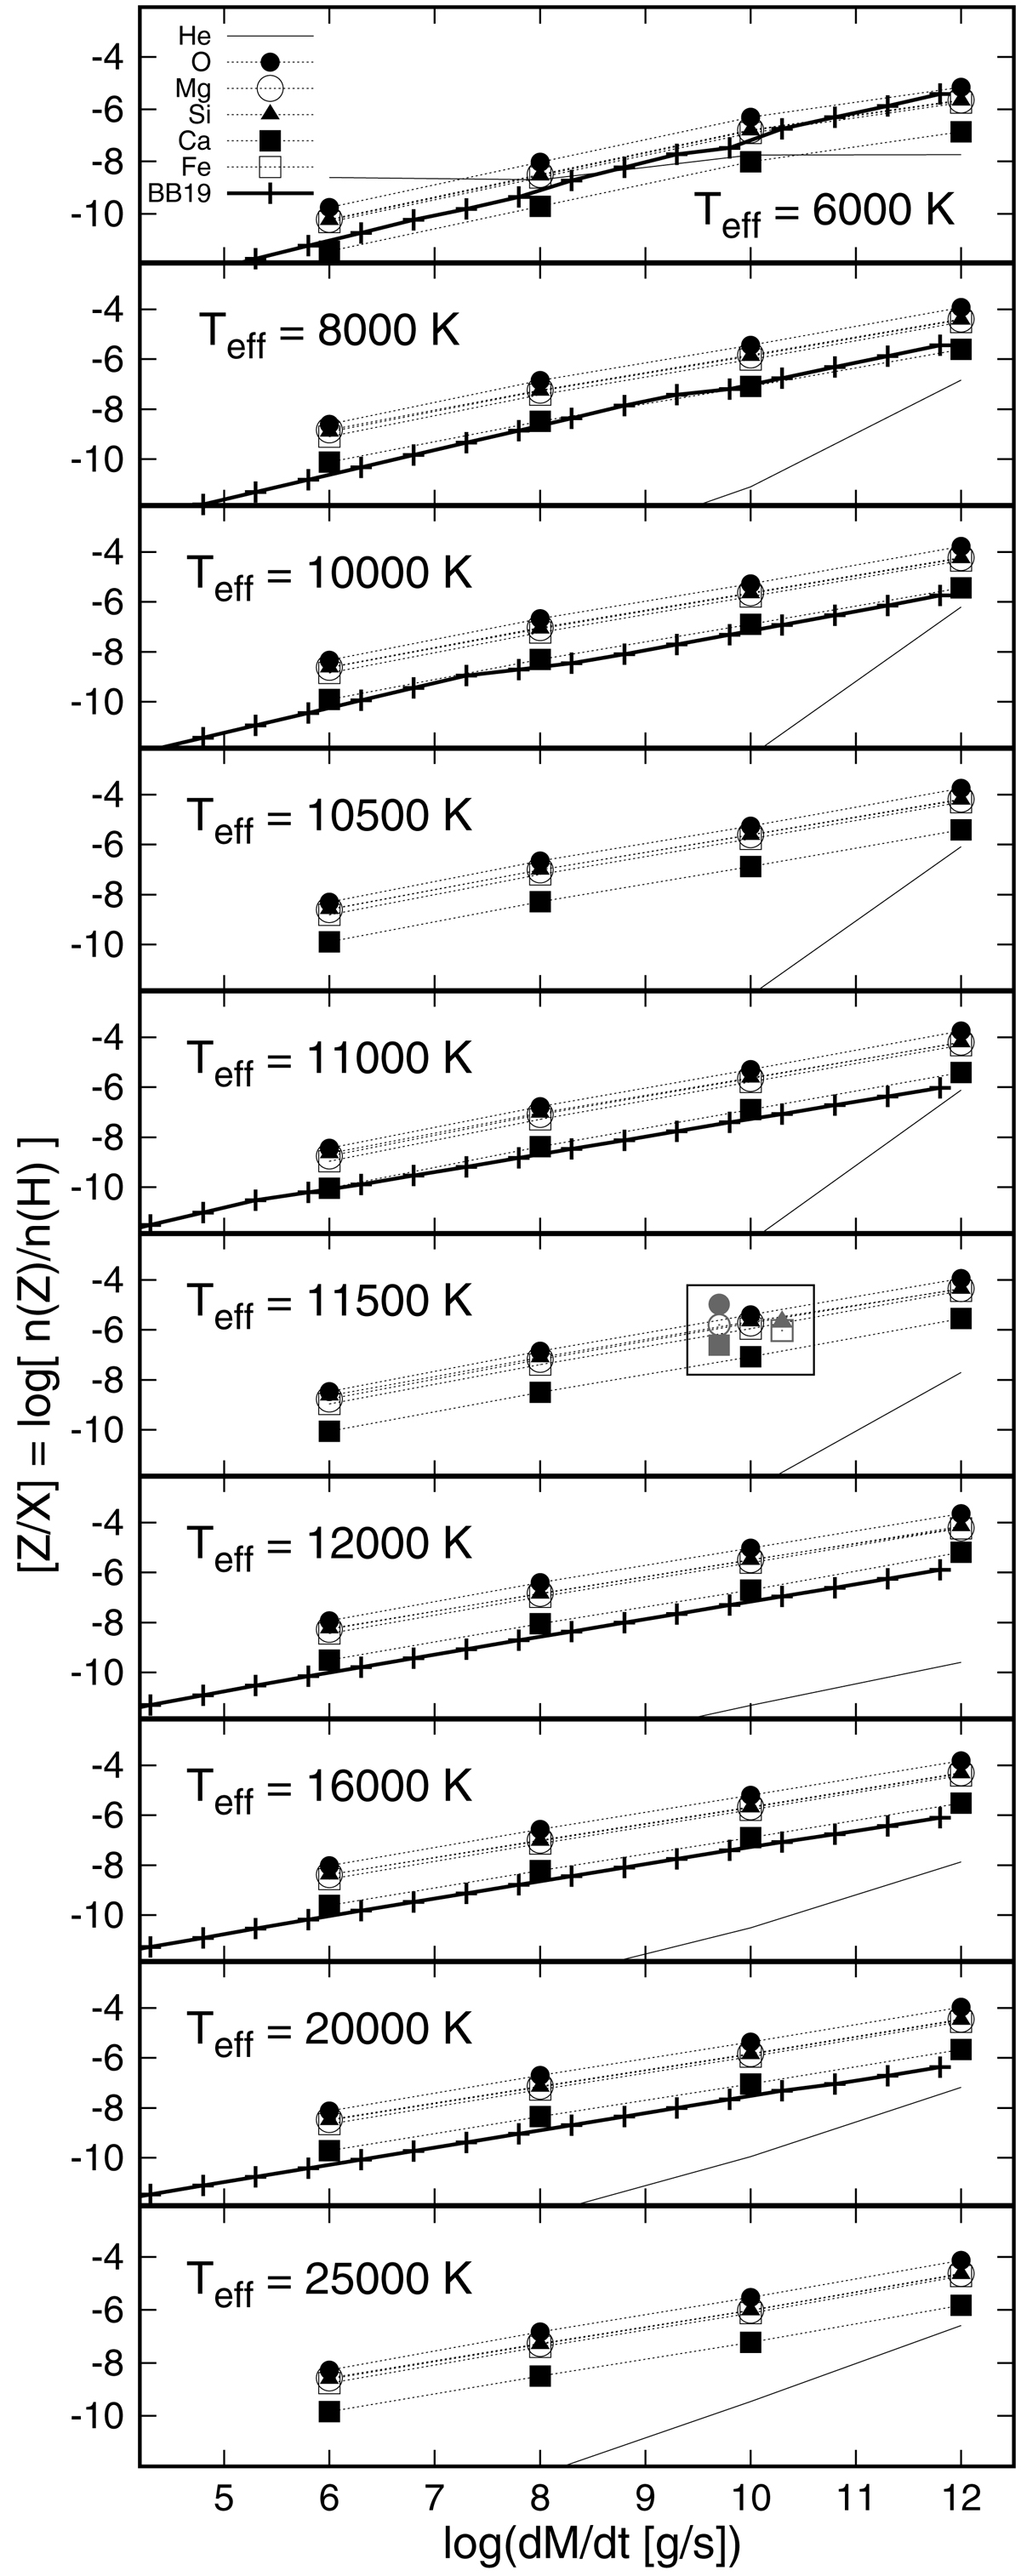
Fig. 11.
Download original image
Same as Fig. 10 but for models with MH = 10−6 M⊙. When possible, 40Ca abundances obtained by Bauer & Bildsten (2019) have been added to the corresponding panel (labeled as BB19). For Teff = 11 500 K, gray symbols (inside a box) represent the abundances obtained by Bauer & Bildsten (2018) for 16O, 24Mg, 28Si, 40Ca, and 56Fe using the observed photospheric abundance of pollutants in G29–38. All these isolated points correspond to an accretion rate of 1010 g s−1 but have been shifted a bit from that particular value for the sake of clarity.
Current usage metrics show cumulative count of Article Views (full-text article views including HTML views, PDF and ePub downloads, according to the available data) and Abstracts Views on Vision4Press platform.
Data correspond to usage on the plateform after 2015. The current usage metrics is available 48-96 hours after online publication and is updated daily on week days.
Initial download of the metrics may take a while.