Free Access
Fig. B.1.
Download original image
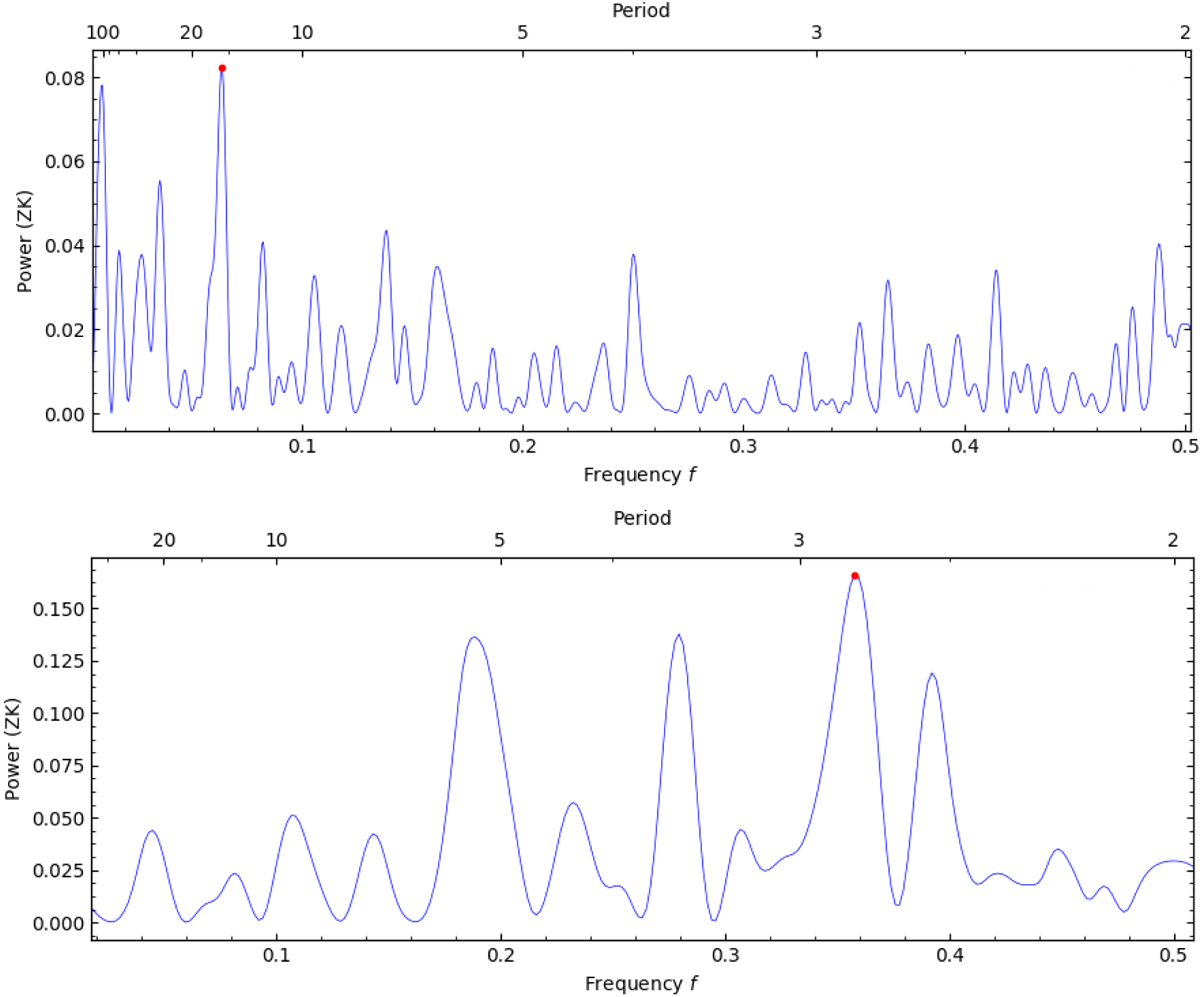
GLS periodogram of 6 GHz Stokes I data set (upper panel) and 33 GHz Stokes I data set (lower panel). Period is given in minutes. The red circles indicate the maximum peak found in the data: 15.7 ± 0.3 minutes at 6 GHz and 2.79 ± 0.05 minutes at 33 GHz.
Current usage metrics show cumulative count of Article Views (full-text article views including HTML views, PDF and ePub downloads, according to the available data) and Abstracts Views on Vision4Press platform.
Data correspond to usage on the plateform after 2015. The current usage metrics is available 48-96 hours after online publication and is updated daily on week days.
Initial download of the metrics may take a while.