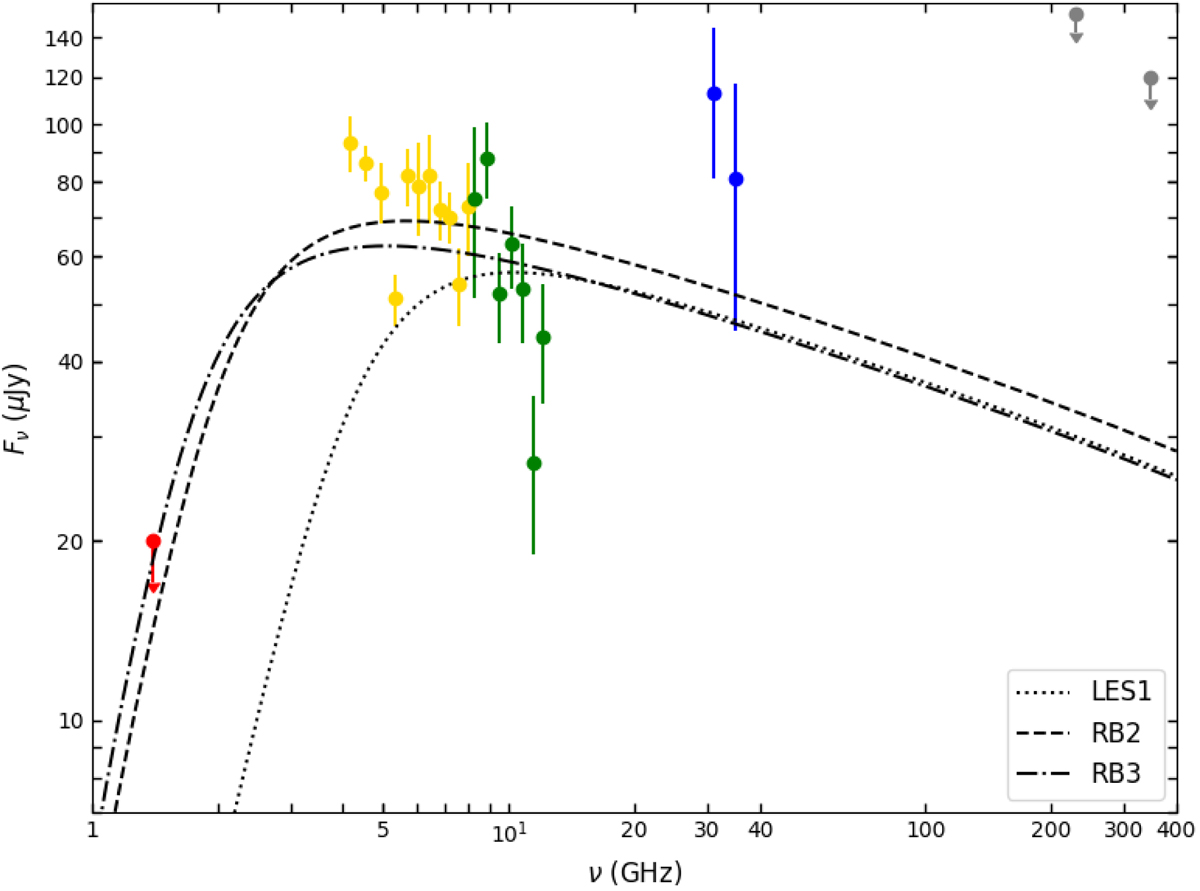
Fig. 4.

Download original image
Total flux density of VHS 1256−1257AB from VLA observations updated with our new data and with published data (Guirado et al. 2018) on a smaller bandwidth sampling (circles). Different colors indicate different bands: 1.4 GHz (red), 6 GHz (yellow), 10 GHz (green), 33 GHz (blue), 230 GHz, and 345 GHz (gray). 3σ non-detections are plotted as arrows. Lines represent different gyrosynchrotron models with δ = 1.36 (see Sect. 5.3.1): dotted line for localized emitting region at the stellar surface with size of 1 R* (LES1) and dashed and dash-dot lines for radiation belts with B0 = 2000 G (RB2) and B0 = 3000 G (RB3), respectively.
Current usage metrics show cumulative count of Article Views (full-text article views including HTML views, PDF and ePub downloads, according to the available data) and Abstracts Views on Vision4Press platform.
Data correspond to usage on the plateform after 2015. The current usage metrics is available 48-96 hours after online publication and is updated daily on week days.
Initial download of the metrics may take a while.


