Fig. 2.
Download original image
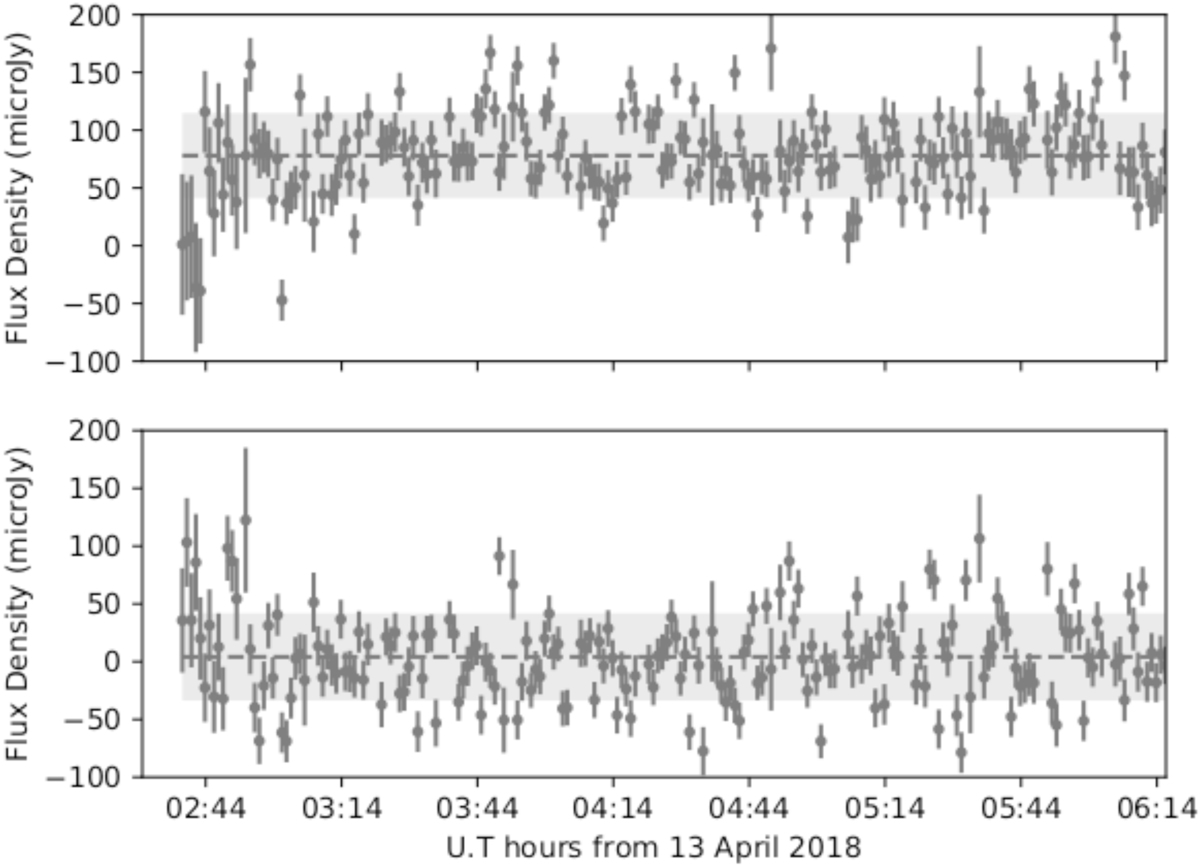
Time evolution of flux density in VHS 1256−1257 at 6 GHz. Upper panel: points show the total flux density (Stokes I) averaged every 60 s, with a mean value of 78 μJy (plotted as a dashed line) and with a standard deviation of 37 μJy (plotted as a gray shadow). Lower panel: same as upper panel, but for Stokes V. The mean and standard deviation values in this case are 4 μJy and 38 μJy, respectively.
Current usage metrics show cumulative count of Article Views (full-text article views including HTML views, PDF and ePub downloads, according to the available data) and Abstracts Views on Vision4Press platform.
Data correspond to usage on the plateform after 2015. The current usage metrics is available 48-96 hours after online publication and is updated daily on week days.
Initial download of the metrics may take a while.