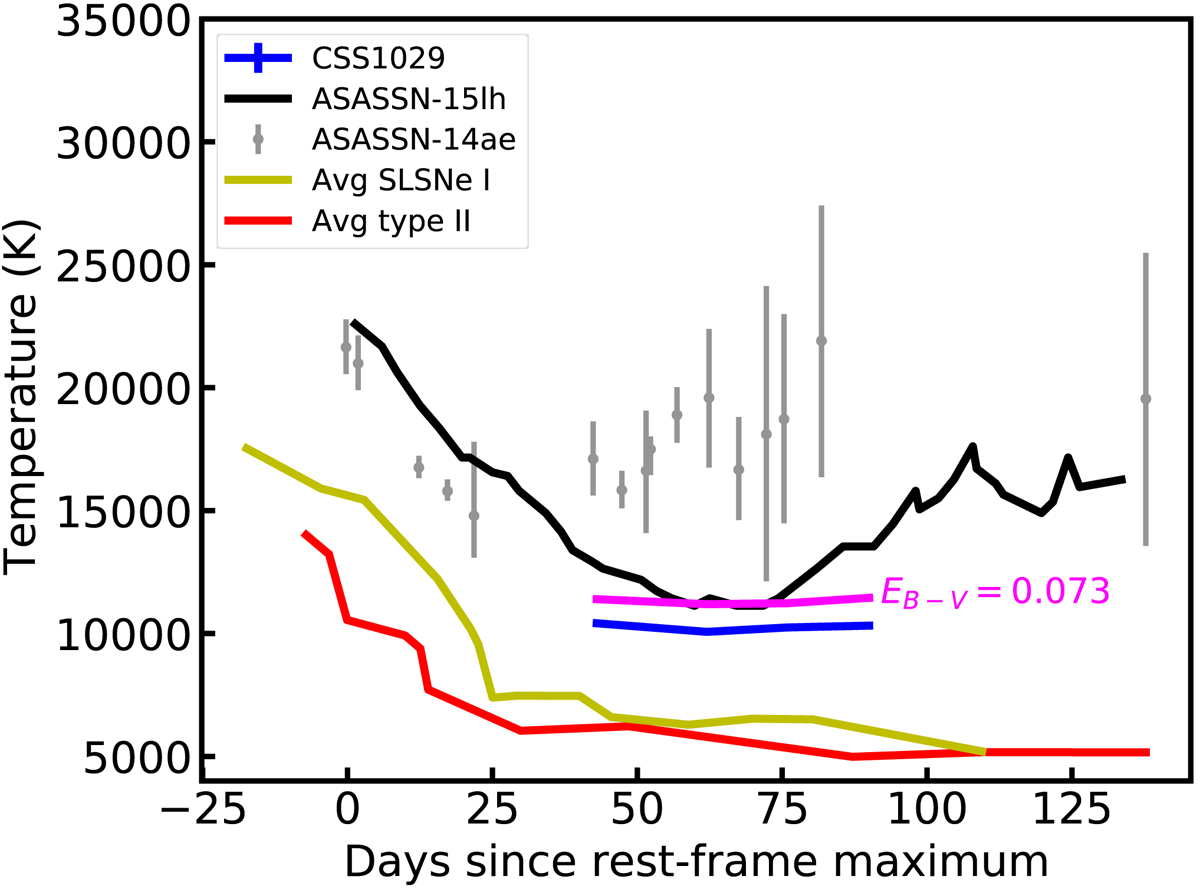
Fig. 9.
Download original image
Temperature evolution of UV-optical emission of CSS1029 compared with that of SLSNe and type II SNe (Inserra et al. 2018). The blue curve shows the blackbody temperature measured from the photometric data corrected for the Galactic dust extinction (EB − V = 0.015), while the purple curve represents that corrected for both the Galactic and internal dust extinction (EB − V = 0.073). The latter is estimated from the Balmer decrement of narrow emission lines (Drake et al. 2011). The temperature evolution of CSS1029 appears similar to that of optical TDE ASASSN-14ae (gray points, Holoien et al. 2014), as well as the peculiar SLSN ASASSN-15lh (black curve, Dong et al. 2016). The latter has been suggested to be more consistent with a TDE based on recent observations (Leloudas et al. 2016).
Current usage metrics show cumulative count of Article Views (full-text article views including HTML views, PDF and ePub downloads, according to the available data) and Abstracts Views on Vision4Press platform.
Data correspond to usage on the plateform after 2015. The current usage metrics is available 48-96 hours after online publication and is updated daily on week days.
Initial download of the metrics may take a while.