Fig. 8.
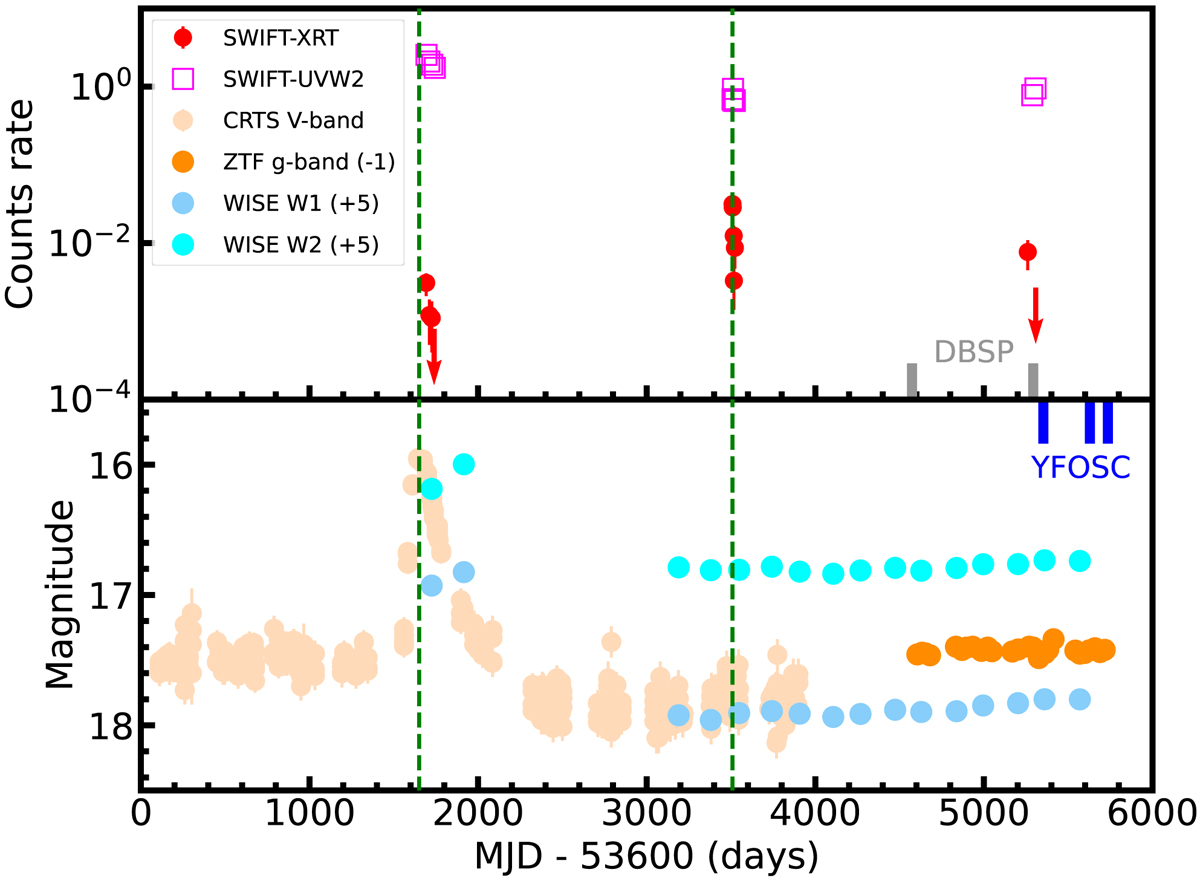
Download original image
Multi-wavelength light curves showing the changes in continuum over the past 15 years for CSS1029. Upper panel: UV (magenta) and X-ray (red) light curves observed from Swift. Bottom panel: light curve in the optical V-band from the CRTS DR2 (light orange), g-band from the ZTF DR2 (dark orange), and in the MIR 3.4 μm (cyan) and 4.6 μm (light blue) from WISE. The green dashed line represents the time of optical peak in 2010, and the X-ray peak in 2015, respectively. The gray thick lines show the time of our DBSP spectroscopy observations, while the blue thick lines indicate the time of YFOSC spectroscopy observations.
Current usage metrics show cumulative count of Article Views (full-text article views including HTML views, PDF and ePub downloads, according to the available data) and Abstracts Views on Vision4Press platform.
Data correspond to usage on the plateform after 2015. The current usage metrics is available 48-96 hours after online publication and is updated daily on week days.
Initial download of the metrics may take a while.