Fig. 7.
Download original image
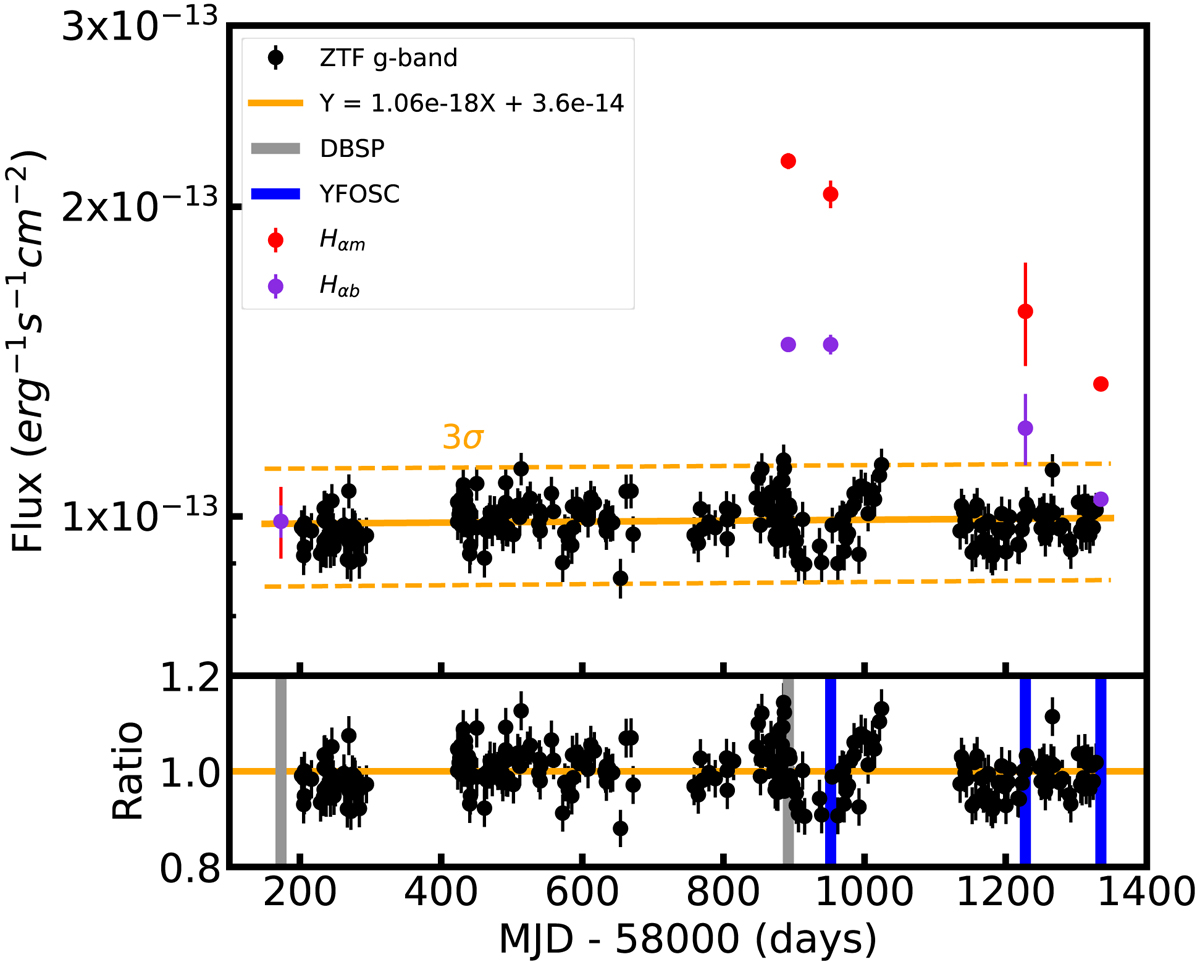
Comparison between the variation in the Hα broad line (purple) and that in medium width component (red) and the observed g-band continuum light curve (black points, see also Fig. 8). The orange solid line represents the linear fit, suggesting that the g-band flux variability can be described by a constant with little evolution over time. The dashed line indicates the 3σ scatter of flux variability relative to its mean. For clarity, the Hα flux has been normalized to the mean g-band flux on the date of Feb 24 2018, the start of our follow-up spectroscopic observations (thick vertical lines). Bottom panel: ratios of the g-band fluxes to the best-fit mean.
Current usage metrics show cumulative count of Article Views (full-text article views including HTML views, PDF and ePub downloads, according to the available data) and Abstracts Views on Vision4Press platform.
Data correspond to usage on the plateform after 2015. The current usage metrics is available 48-96 hours after online publication and is updated daily on week days.
Initial download of the metrics may take a while.