Fig. 3.
Download original image
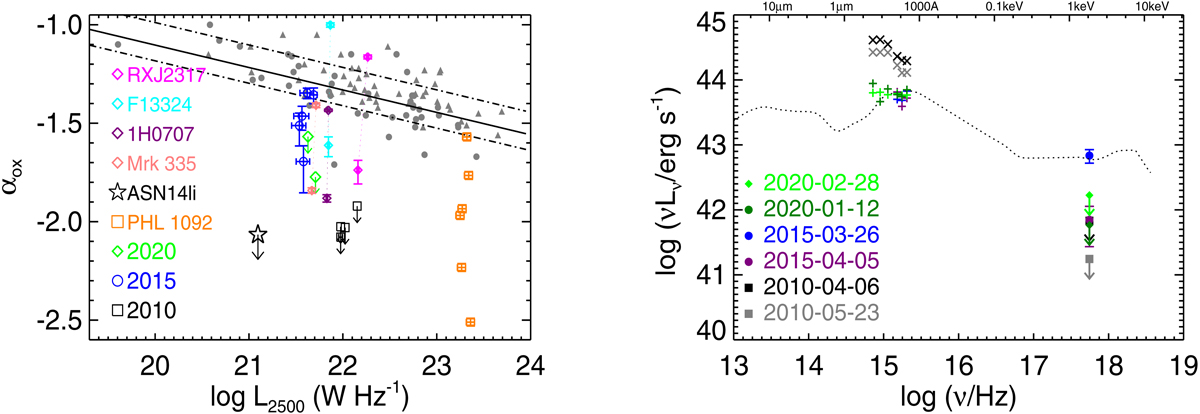
Left: UV-to-X-ray spectral index αox versus 2500 Å luminosity for CSS1029 (black, green and blue symbols). The solid line represents the fit to the X-ray-selected AGNs from Grupe et al. (2010). The NSy1s are shown as gray dots, while the broad-line Sy1s are shown as gray triangles. For comparison, we also plot the αox for four typical NSy1s with extreme X-ray variations. The αox were calculated in the same manner as CSS1029. For clarity, only the two data points representing observations between the high and low state are shown. The open star represents the data for the thermal TDE ASASSN-14li in the flare state (van Velzen et al. 2016). Right: optical to X-ray SED of CSS1029. For clarity, only the data for the highest and lowest state within each epoch are shown. The median SED from radio-quiet quasars (Elvis et al. 1994) is also shown for comparison (dotted line), for which the luminosity is scaled to that of UVW2 obtained in the high state in 2015.
Current usage metrics show cumulative count of Article Views (full-text article views including HTML views, PDF and ePub downloads, according to the available data) and Abstracts Views on Vision4Press platform.
Data correspond to usage on the plateform after 2015. The current usage metrics is available 48-96 hours after online publication and is updated daily on week days.
Initial download of the metrics may take a while.