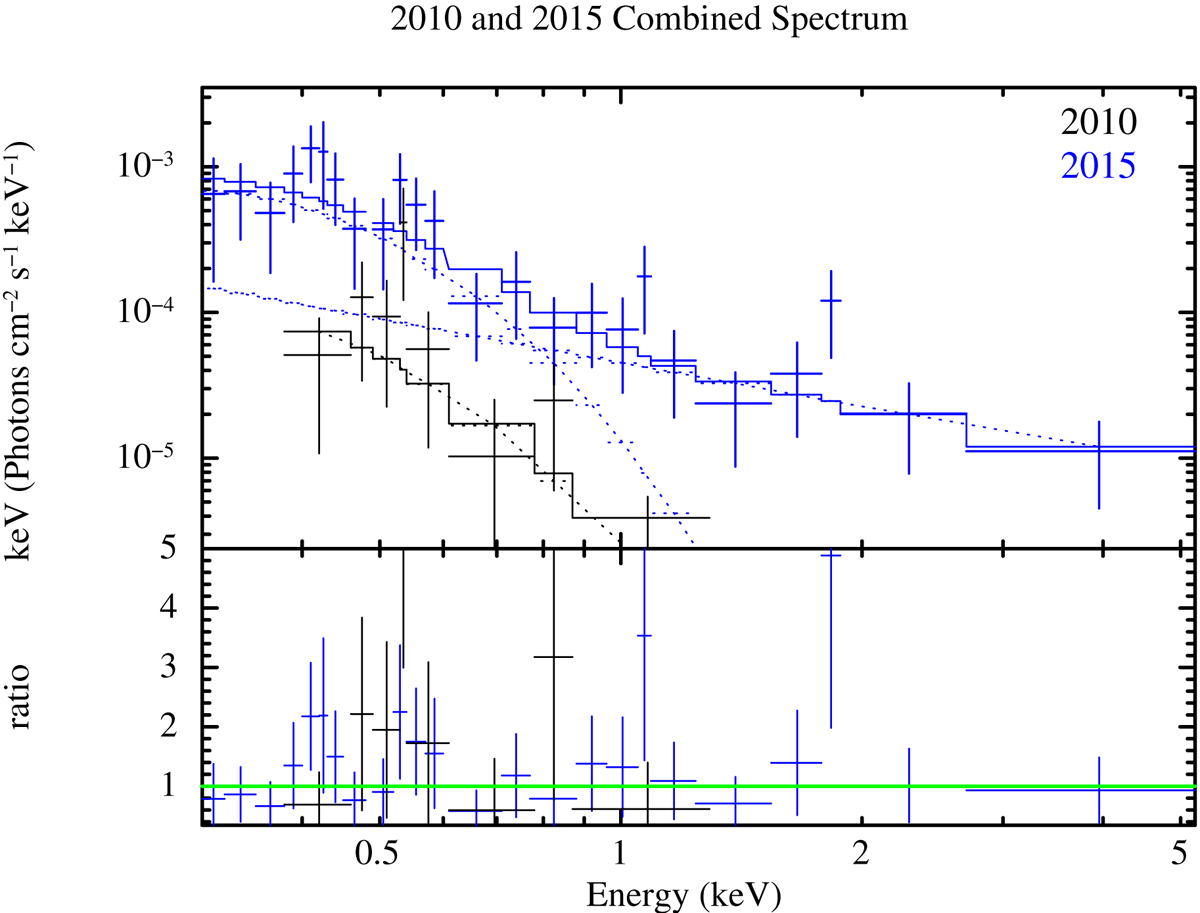
Fig. 2.
Download original image
X-ray spectrum by stacking three observations in 2010 (black) and five observations in 2015 (blue). The dotted line shows the best-fitted model consisting of a power law and a blackbody component. We note that the spectral fittings were performed jointly to the 2010 and 2015 data based on this model. The corresponding data-to-model ratios are shown in the bottom panel.
Current usage metrics show cumulative count of Article Views (full-text article views including HTML views, PDF and ePub downloads, according to the available data) and Abstracts Views on Vision4Press platform.
Data correspond to usage on the plateform after 2015. The current usage metrics is available 48-96 hours after online publication and is updated daily on week days.
Initial download of the metrics may take a while.