Fig. 1.
Download original image
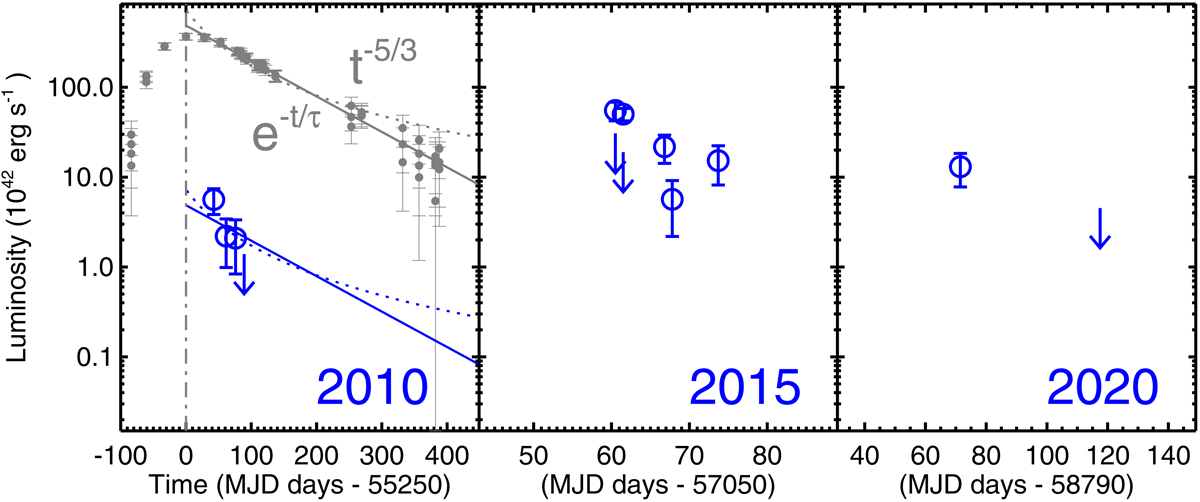
X-ray light curves observed at different epochs. Left panel: the evolution of the host-subtracted optical luminosity at the V-band is also shown (gray points, in units of 1042erg s−1). The solid line shows the best exponential fit, while the dotted line is the fit with the canonical t−5/3 decay law. The two best-fit lines are scaled down by a factor of 100 to match the X-ray light curve.
Current usage metrics show cumulative count of Article Views (full-text article views including HTML views, PDF and ePub downloads, according to the available data) and Abstracts Views on Vision4Press platform.
Data correspond to usage on the plateform after 2015. The current usage metrics is available 48-96 hours after online publication and is updated daily on week days.
Initial download of the metrics may take a while.