Free Access
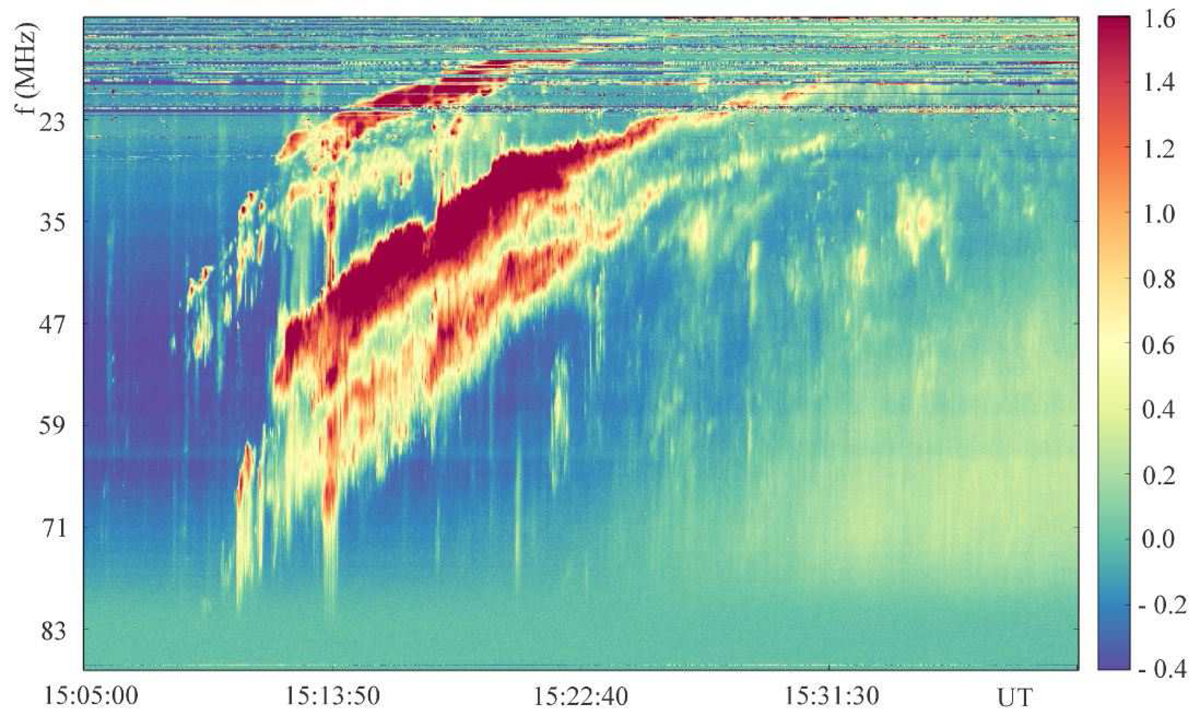
Fig. 1.
Download original image
Dynamic radio spectrum in the frequency range 10−90 MHz as recorded with the radio telescope LOFAR during the period 15:10−15:30 UT on 25 August 2014 The intensity is colour coded in arbitrary units as seen in the bar on the right-hand side (adapted from Magdalenic et al. 2020).
Current usage metrics show cumulative count of Article Views (full-text article views including HTML views, PDF and ePub downloads, according to the available data) and Abstracts Views on Vision4Press platform.
Data correspond to usage on the plateform after 2015. The current usage metrics is available 48-96 hours after online publication and is updated daily on week days.
Initial download of the metrics may take a while.