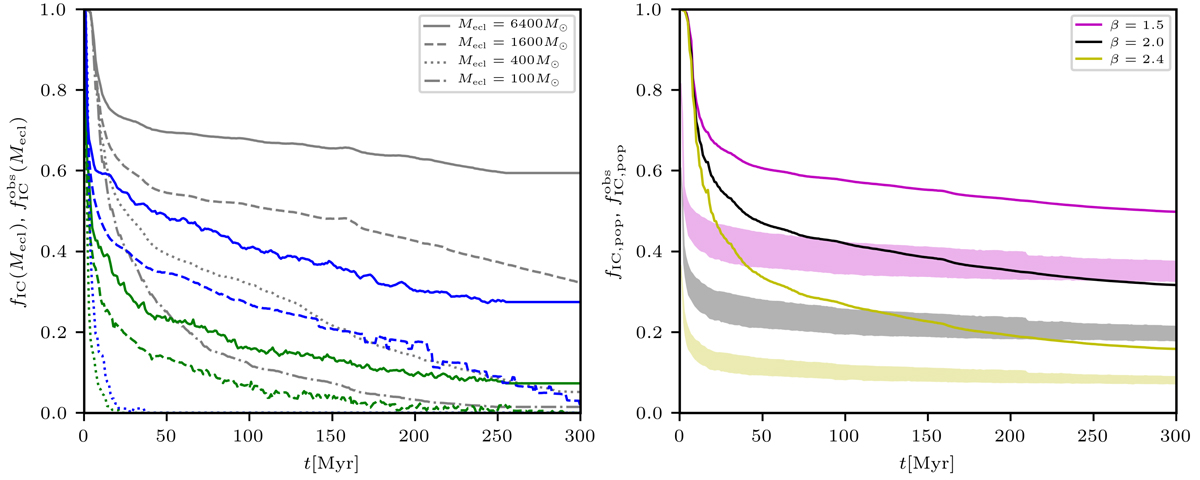
Fig. A.1.
Download original image
Left panel shows the time dependence of the physical fraction of stars in clusters (gray lines; the same as Figure 1) and the estimated observed fraction of stars in clusters when using rsearch = 5 pc (blue lines) and rsearch = 2 pc (green lines). The cluster mass is indicated by the line style. The right panel shows the time dependence of the physical fraction of stars in clusters (solid lines) and the estimated observed fraction of stars in clusters assuming rsearch between 2 to 5 pc (filled areas). This panel is for the ECMF of Eq. (4) with β = 1.5 (magenta), β = 2 (black), and β = 2.4 (yellow).
Current usage metrics show cumulative count of Article Views (full-text article views including HTML views, PDF and ePub downloads, according to the available data) and Abstracts Views on Vision4Press platform.
Data correspond to usage on the plateform after 2015. The current usage metrics is available 48-96 hours after online publication and is updated daily on week days.
Initial download of the metrics may take a while.