Fig. 5.
Download original image
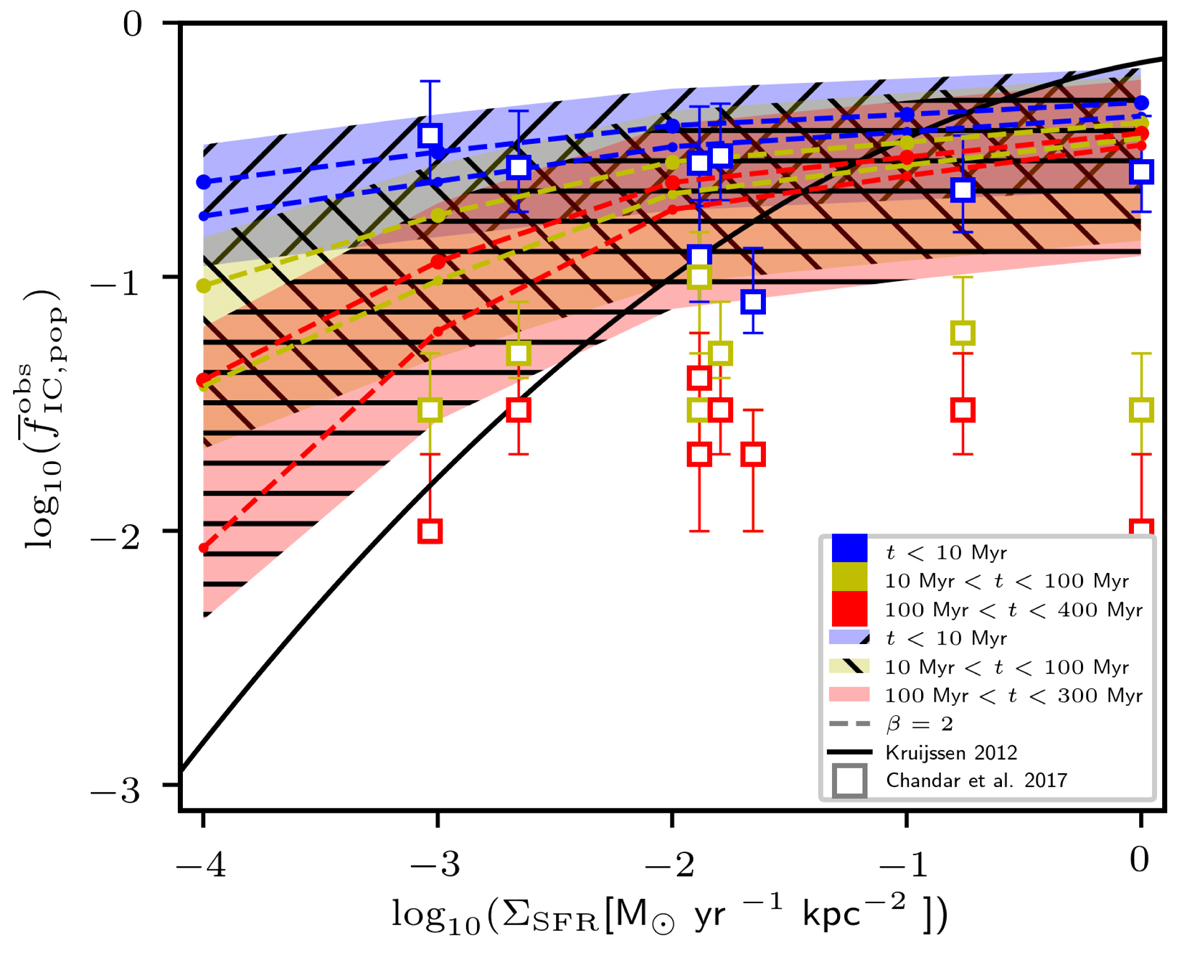
Likely detected fraction of stars in clusters of age t < 10 Myr (blue area and blue lines), 10 Myr < t < 100 Myr (yellow area and yellow lines), and 100 Myr < t < 300 Myr (red area and red lines) as a function of ΣSFR. Apart from indicating age by colour, age is also shown by a hatch style. The coloured area is bordered by two extreme models: the lower one has β = 2.2 and rsearch = 2 pc, the upper one has β = 1.8 and rsearch = 5 pc. The models for β = 2.0 and rsearch = 2 pc and 5 pc are shown by the dashed lines. The plot shows how ![]() increases with the ΣSFR, and how it decreases with the cluster age. The observational data from Chandar et al. (2017), which are aimed consistently at galaxies both with low SFR and high SFR, are shown by empty squares with their errorbars. Our results are obtained at almost the same time intervals as the observational data (indicated by the colours). The semi-analytic estimate provided by the Γ − ΣSFR model is shown by the black solid line. We note its disagreement with the observational data for the clusters of any age interval.
increases with the ΣSFR, and how it decreases with the cluster age. The observational data from Chandar et al. (2017), which are aimed consistently at galaxies both with low SFR and high SFR, are shown by empty squares with their errorbars. Our results are obtained at almost the same time intervals as the observational data (indicated by the colours). The semi-analytic estimate provided by the Γ − ΣSFR model is shown by the black solid line. We note its disagreement with the observational data for the clusters of any age interval.
Current usage metrics show cumulative count of Article Views (full-text article views including HTML views, PDF and ePub downloads, according to the available data) and Abstracts Views on Vision4Press platform.
Data correspond to usage on the plateform after 2015. The current usage metrics is available 48-96 hours after online publication and is updated daily on week days.
Initial download of the metrics may take a while.