Fig. 2.
Download original image
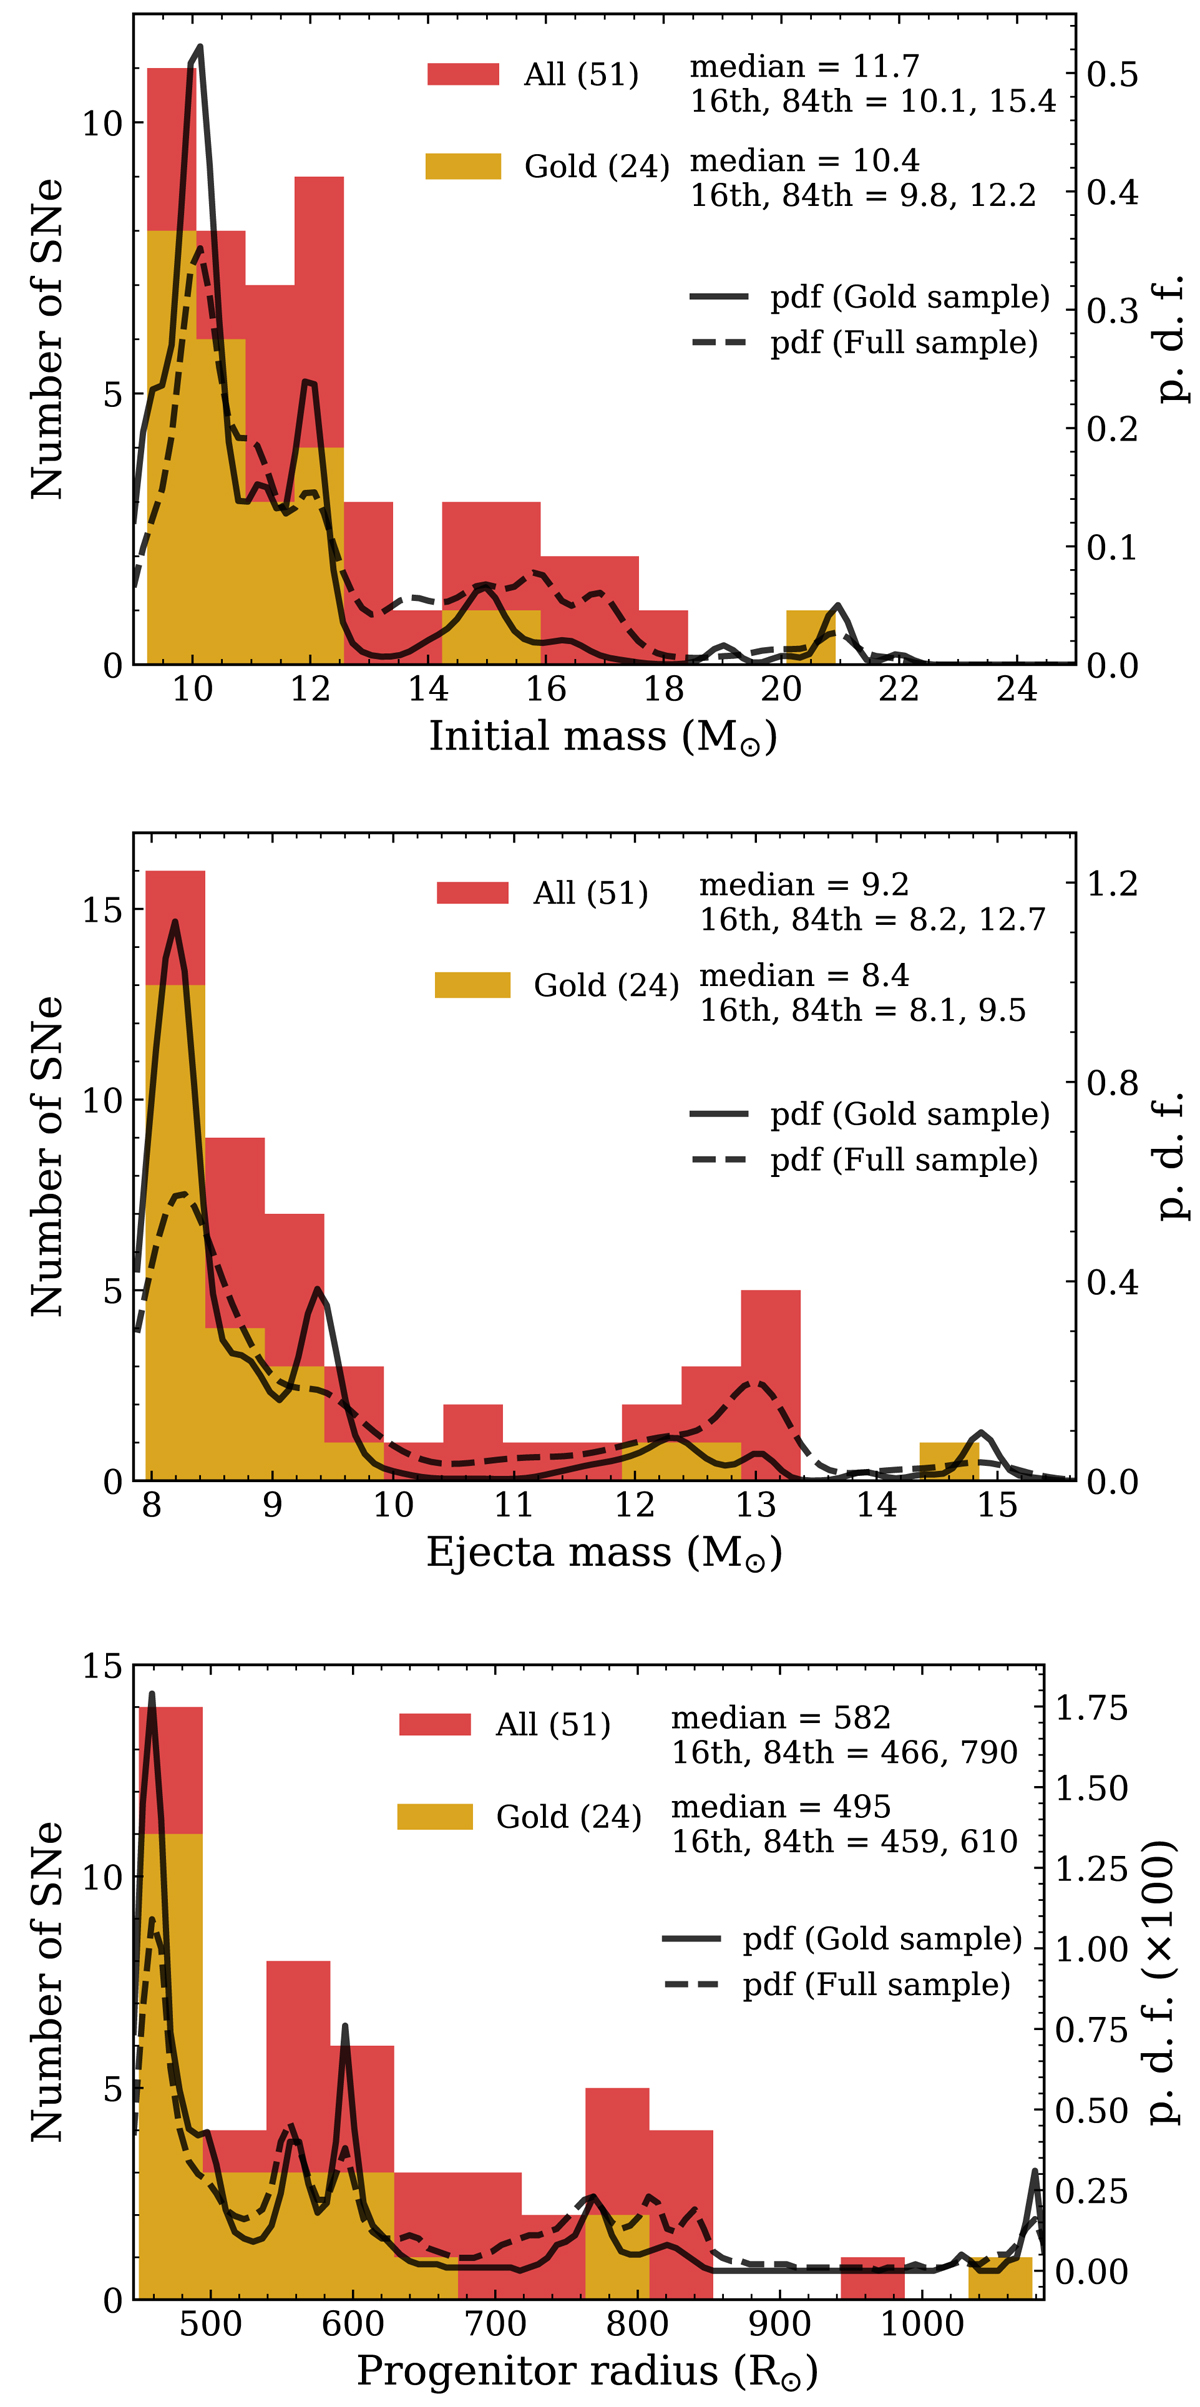
Histograms of three progenitor parameters: MZAMS (top panel), Mej (middle panel), and R (bottom panel). The gold sample is represented by yellow bars, and the red bars are the histograms for the full sample. In each panel, the number of SNe II is listed, together with the median and the 16th and 84th percentiles. Probability density functions of the physical parameters for the gold and full samples are represented by solid and dashed lines, respectively.
Current usage metrics show cumulative count of Article Views (full-text article views including HTML views, PDF and ePub downloads, according to the available data) and Abstracts Views on Vision4Press platform.
Data correspond to usage on the plateform after 2015. The current usage metrics is available 48-96 hours after online publication and is updated daily on week days.
Initial download of the metrics may take a while.