Fig. D.1.
Download original image
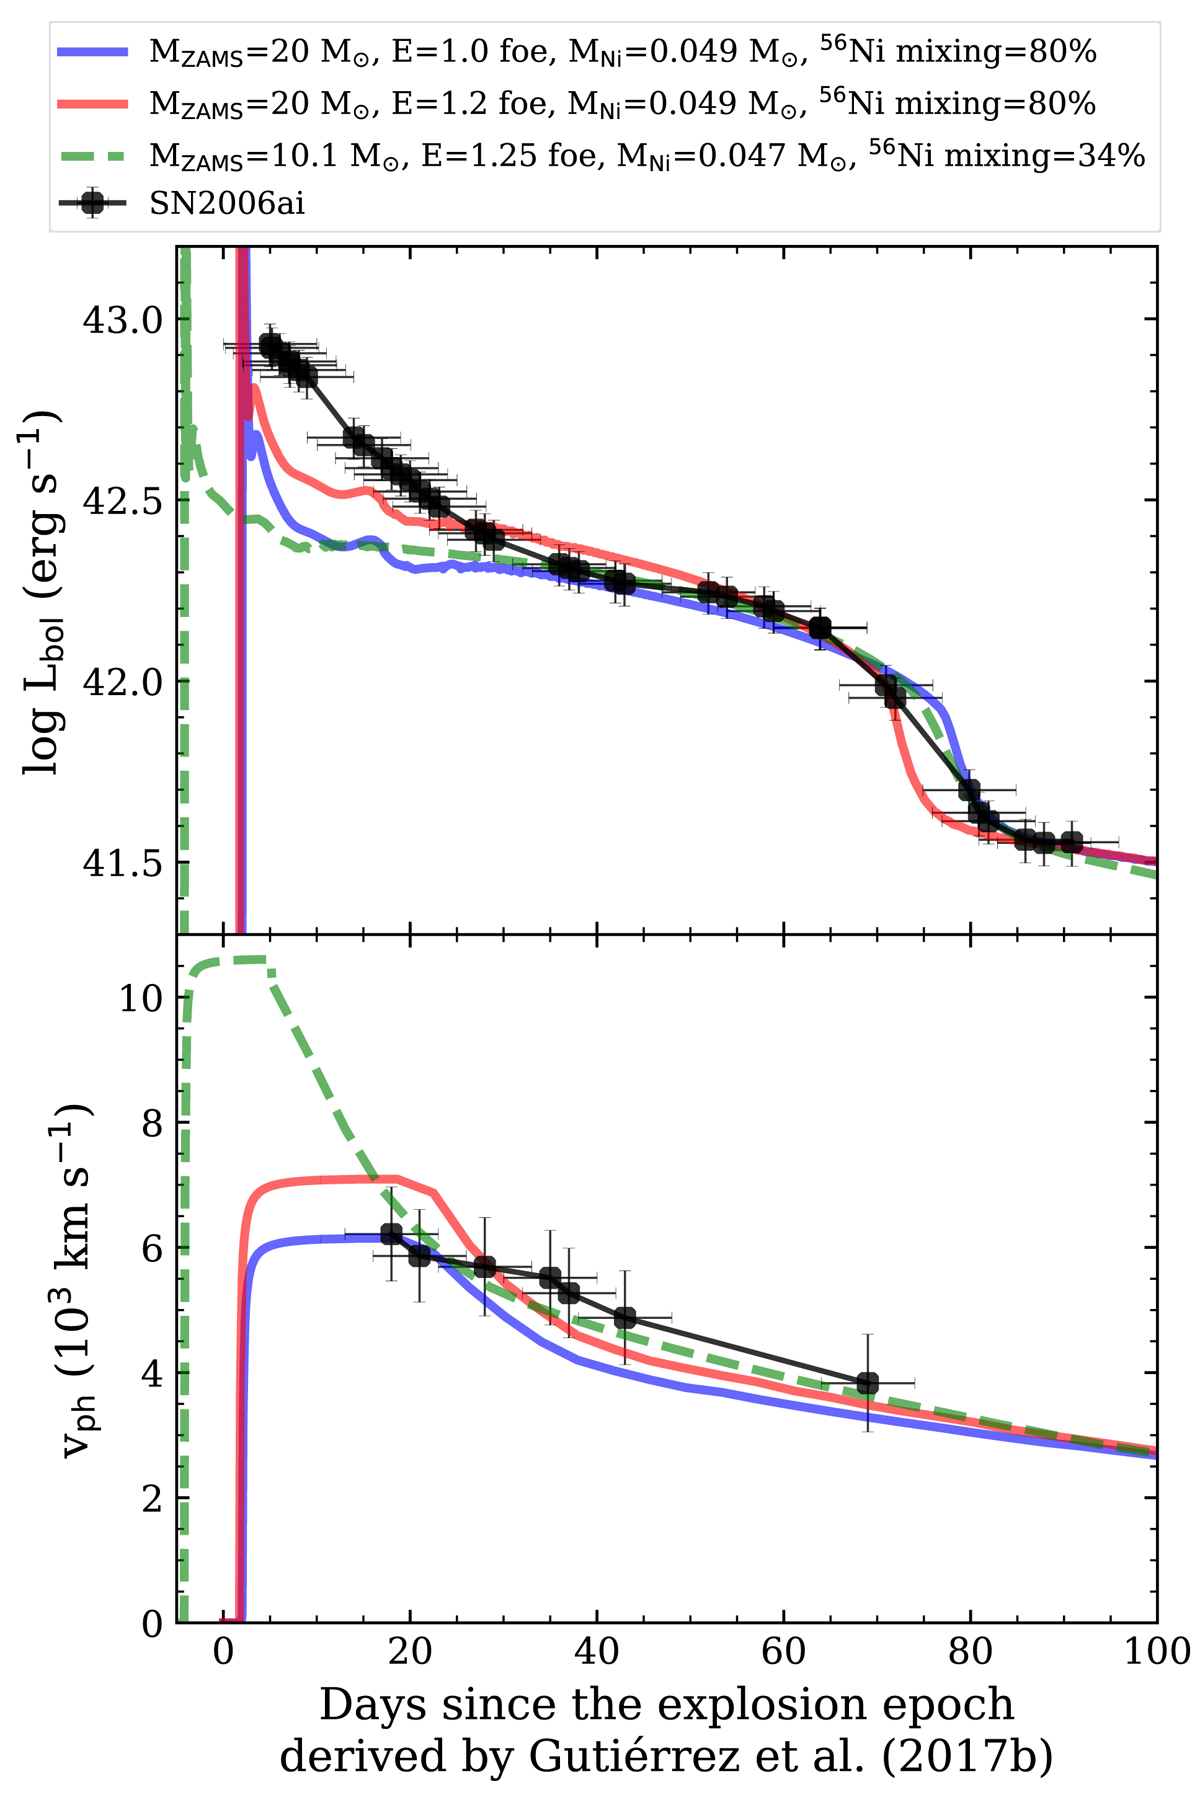
Observed bolometric LC (top panel) and Fe IIλ5169 line velocities of SN 2006ai (black markers). Solid lines represent the high-MZAMS models with increased mass loss that best reproduce the observations. Dashed lines represent the maximum a posteriori model using our standard grid of models. This model is corrected by the scale factor and the explosion epoch found in Sect. 5. Since our estimation suggests an earlier explosion epoch, the model shown as dashed lines starts before zero on the x axis (where zero corresponds to the explosion epoch derived by Gutiérrez et al. 2017b).
Current usage metrics show cumulative count of Article Views (full-text article views including HTML views, PDF and ePub downloads, according to the available data) and Abstracts Views on Vision4Press platform.
Data correspond to usage on the plateform after 2015. The current usage metrics is available 48-96 hours after online publication and is updated daily on week days.
Initial download of the metrics may take a while.