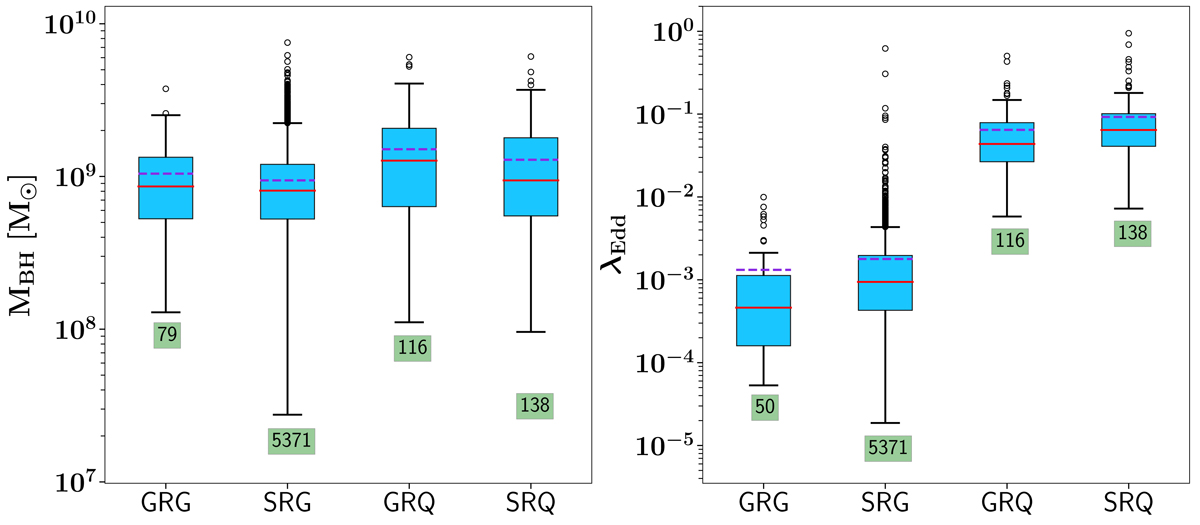
Fig. 8.
Download original image
Box plots as described in Sect. 5.2, which show distributions of black hole mass (left) and Eddington ratio (right) for GRGs, SRGs, SRQs, and GRQs. The number shown in the green box represents the number of sources in each sample. The solid red line indicates the median of the distribution, and the dashed purple line denotes the mean.
Current usage metrics show cumulative count of Article Views (full-text article views including HTML views, PDF and ePub downloads, according to the available data) and Abstracts Views on Vision4Press platform.
Data correspond to usage on the plateform after 2015. The current usage metrics is available 48-96 hours after online publication and is updated daily on week days.
Initial download of the metrics may take a while.