Free Access
Fig. B.4
Download original image
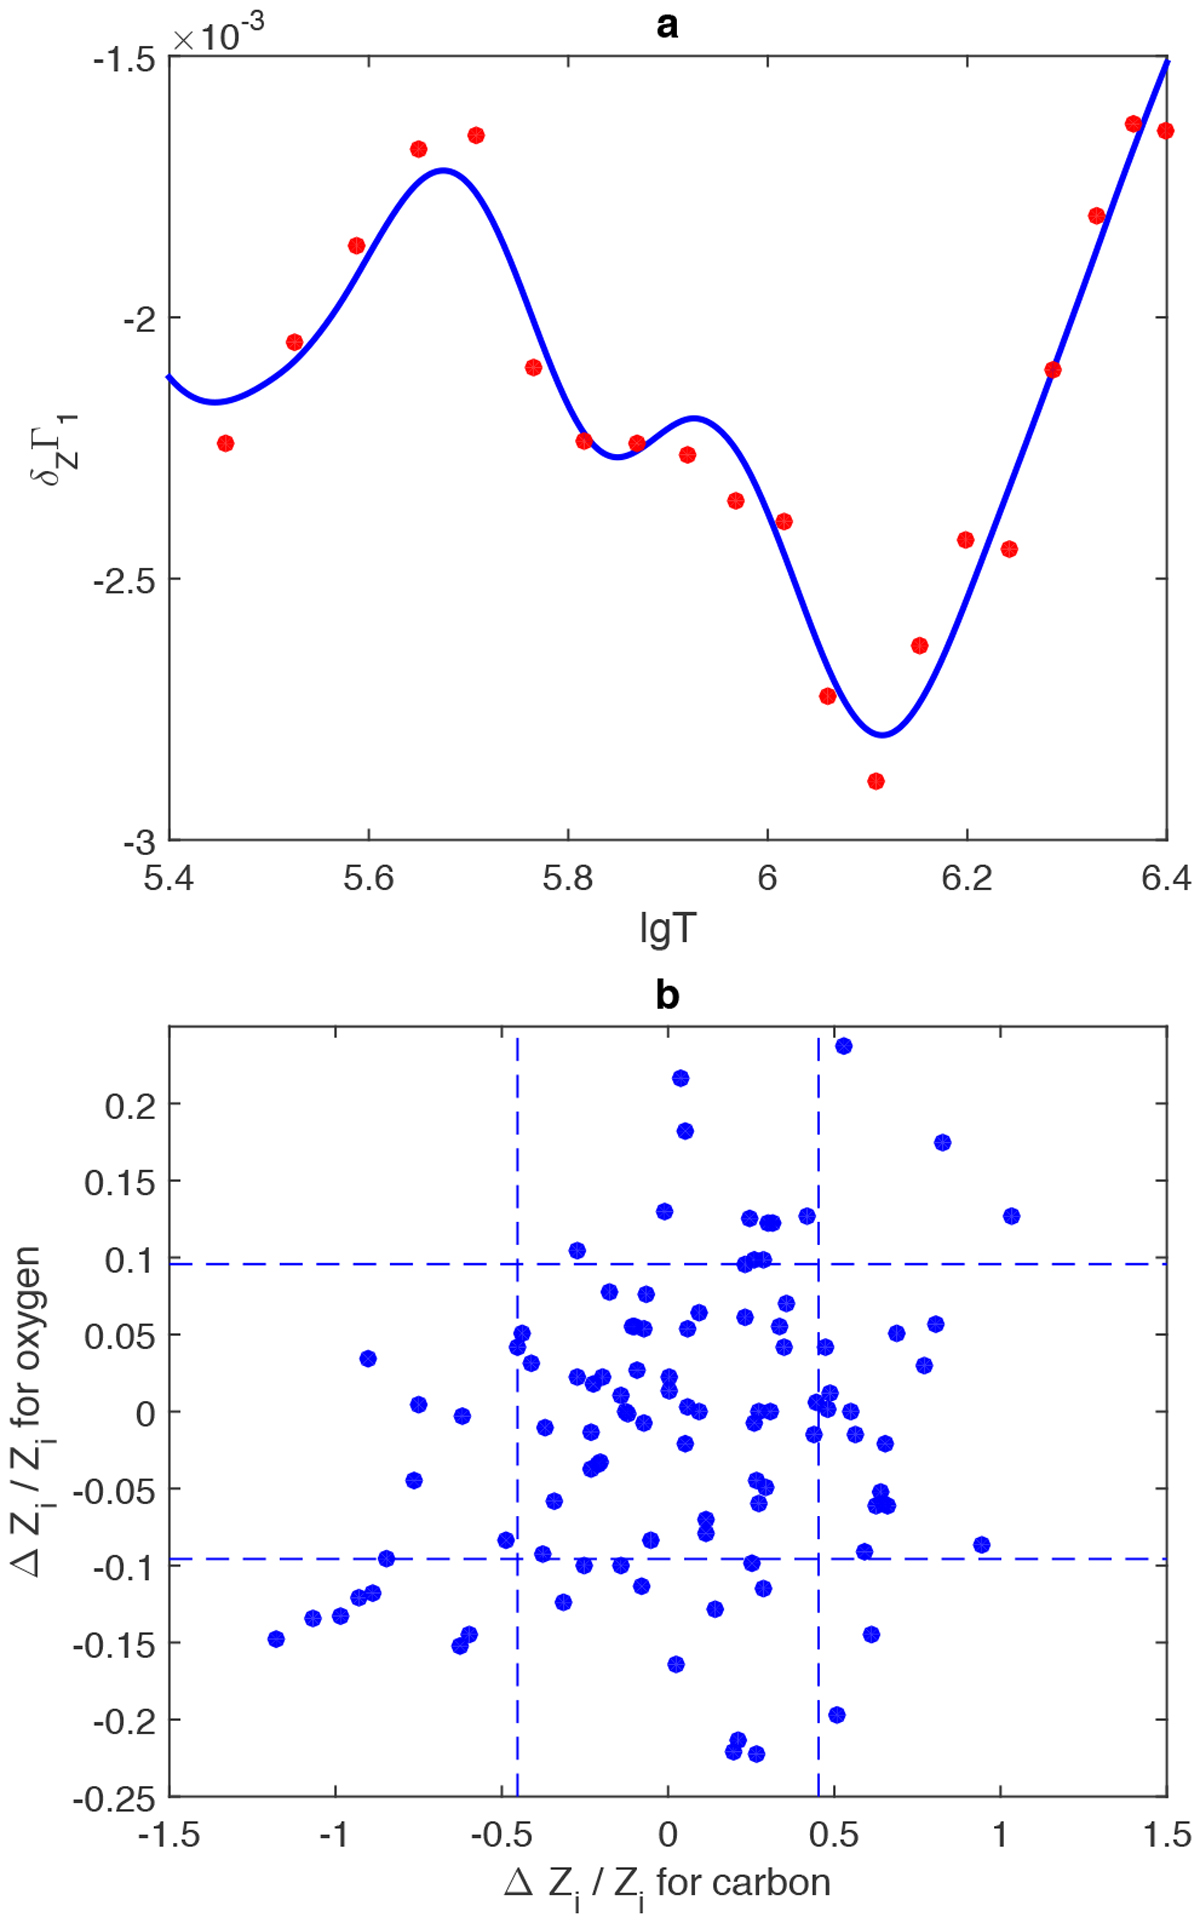
(a) Precise Z contribution δZΓ1 from SAHA-S (blue line) and an example of random errors (red points). (b) Resulting errors of oxygen and carbon max fractions (points) in 100 experiments. Dashed lines are standard deviations normalized to main values.
Current usage metrics show cumulative count of Article Views (full-text article views including HTML views, PDF and ePub downloads, according to the available data) and Abstracts Views on Vision4Press platform.
Data correspond to usage on the plateform after 2015. The current usage metrics is available 48-96 hours after online publication and is updated daily on week days.
Initial download of the metrics may take a while.