Free Access
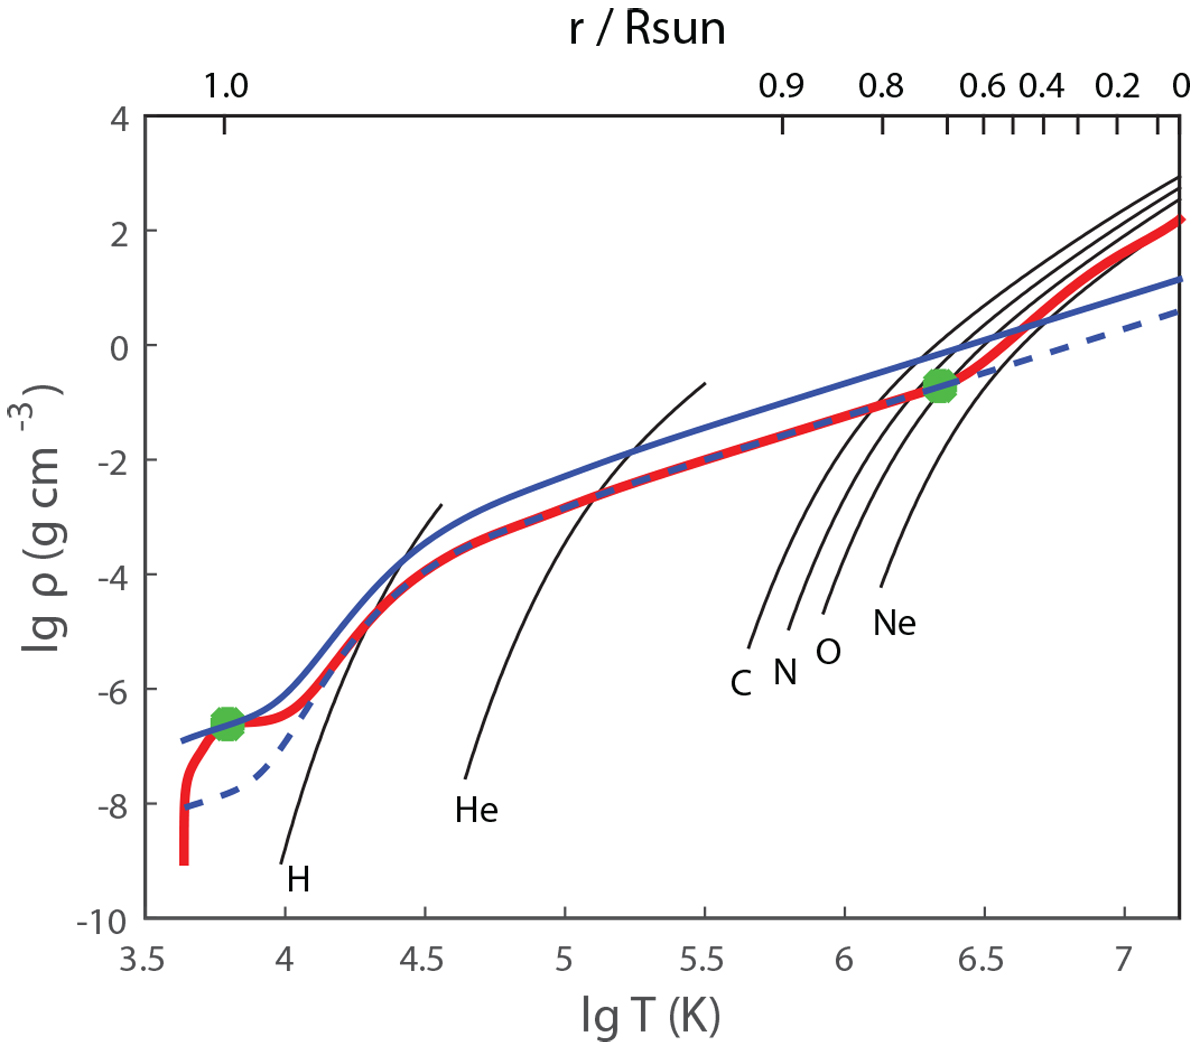
Fig. 1
Download original image
Temperature and density in the standard solar model (red curve). Filled green points mark the boundaries of the convection zone. Blue curves are adiabats. Black curves show points where 50% ionization of the last electron occurs. The top axis shows the corresponding radius in the solar model.
Current usage metrics show cumulative count of Article Views (full-text article views including HTML views, PDF and ePub downloads, according to the available data) and Abstracts Views on Vision4Press platform.
Data correspond to usage on the plateform after 2015. The current usage metrics is available 48-96 hours after online publication and is updated daily on week days.
Initial download of the metrics may take a while.