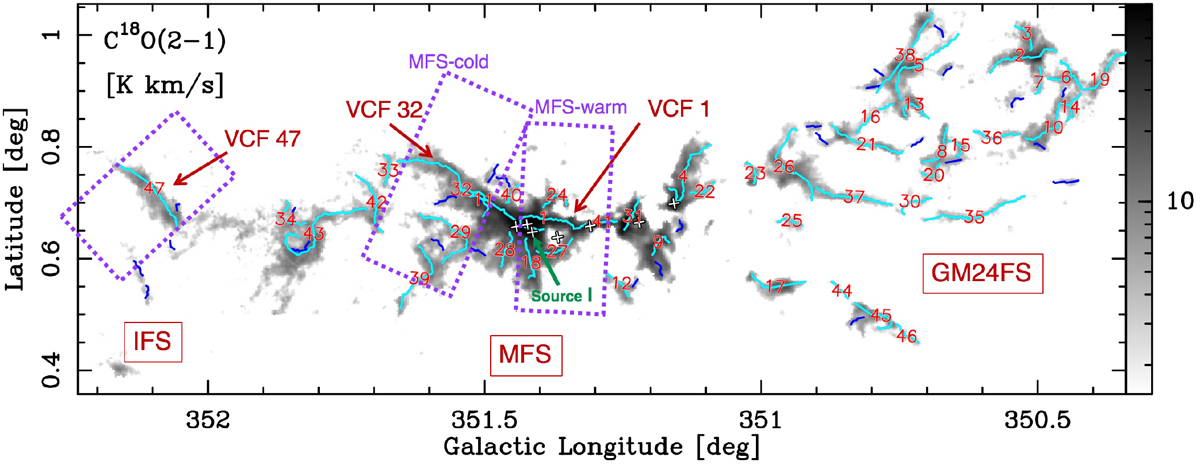
Fig. 6
Download original image
Integrated intensity map, in units of K km s-1, of the C18O(2–1) emission (same as Fig. 2). The colored curves show the crests of the velocity coherent filaments (VCFs) identified using CRISPy. The crests with total length (L) larger than 10 pixels are traced in cyan and numbered. VCFs 1, 32, and 47 are identified with red arrows. The dotted purple boxes indicate the regions from which the averaged radial profiles and the PV maps are derived (see Sects. 6.1 and 6.2). The white crosses indicate the seven infrared high-mass star-forming regions, which are usually referred to as sources I(N), E, I, II, III, IV, and V (from east to west) (Persi & Tapia 2008; Arzoumanian et al. 2021). Source I is indicated with the green arrow.
Current usage metrics show cumulative count of Article Views (full-text article views including HTML views, PDF and ePub downloads, according to the available data) and Abstracts Views on Vision4Press platform.
Data correspond to usage on the plateform after 2015. The current usage metrics is available 48-96 hours after online publication and is updated daily on week days.
Initial download of the metrics may take a while.