Fig. 2
Download original image
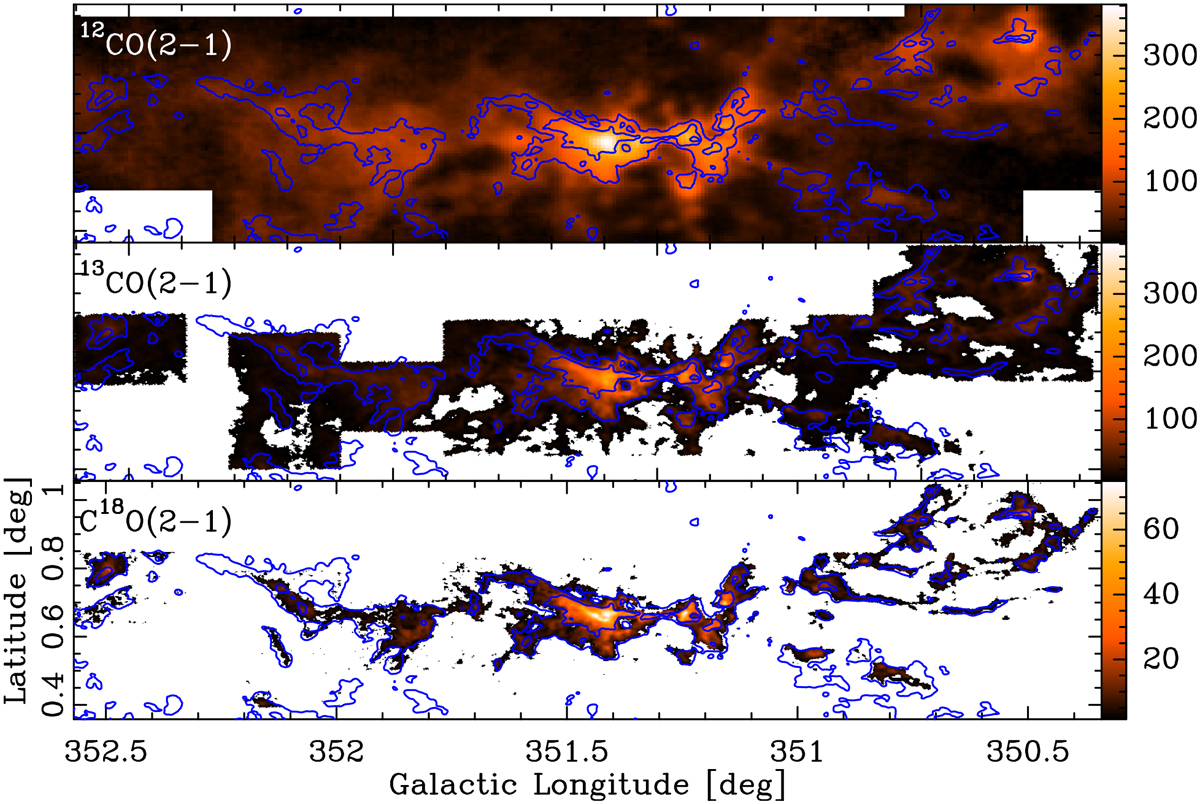
Integrated intensity maps, in units of K kms-1, of the 12CO(2–1),13CO(2-1), and C18O(2–1) emission (from top to bottom). The 13CO(2–1) and C18O(2–1) maps have a spatial resolution of 30.′2 (corresponding to 0.19 pc at the 1.3 kpc distance of the cloud) and the emission is integrated over the LSR velocity range -12 to 4 kms-1. The 12CO(2–1) map has a spatial resolution of 90° and the emission is integrated over the LSR velocity range -25 to 12 kms-1. The blue contours trace column densities of 1.8 and 5.0 × 1022 cm-2 derived from Herschel data (at 36.″3) and are the same in all three panels.
Current usage metrics show cumulative count of Article Views (full-text article views including HTML views, PDF and ePub downloads, according to the available data) and Abstracts Views on Vision4Press platform.
Data correspond to usage on the plateform after 2015. The current usage metrics is available 48-96 hours after online publication and is updated daily on week days.
Initial download of the metrics may take a while.