Fig. B.3
Download original image
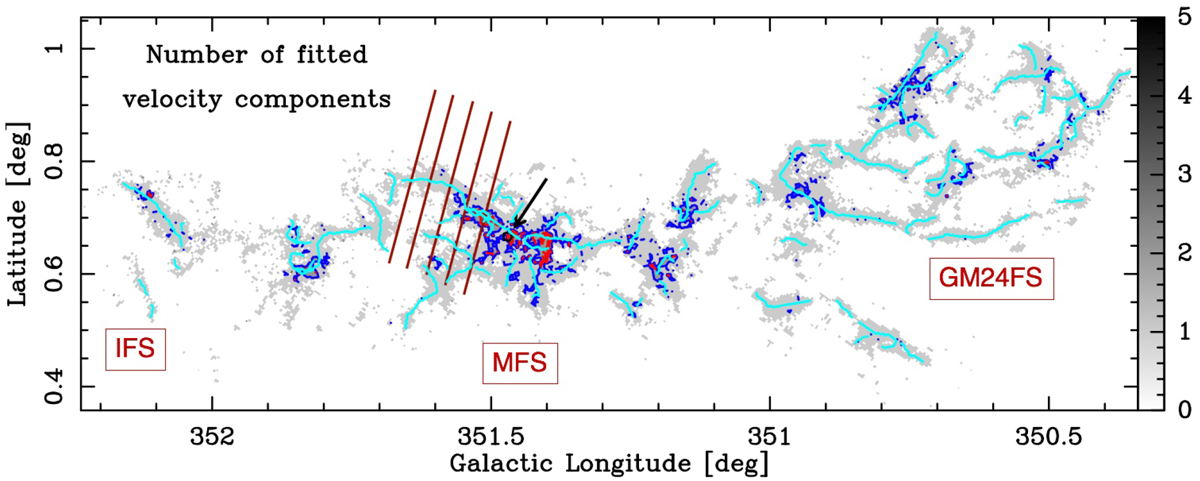
Map showing the number of fitted velocity components for each C18O(2–1) spectra. The blue and red contours indicate velocity components = 2 and = 3, respectively. More than 88% of the spectra are fitted with a single velocity component and only ~12% of the spectra required two or three velocity components to fit the observed spectra. The cyan curves trace the crests of the identified velocity coherent filaments (same as in Fig. 6). The black arrow toward the MFS indicates the location of the spectrum shown in Fig. B.1. The red lines indicate the central positions of the slices used to derive the PV diagrams shown in Fig. C.1.
Current usage metrics show cumulative count of Article Views (full-text article views including HTML views, PDF and ePub downloads, according to the available data) and Abstracts Views on Vision4Press platform.
Data correspond to usage on the plateform after 2015. The current usage metrics is available 48-96 hours after online publication and is updated daily on week days.
Initial download of the metrics may take a while.