Fig. 10
Download original image
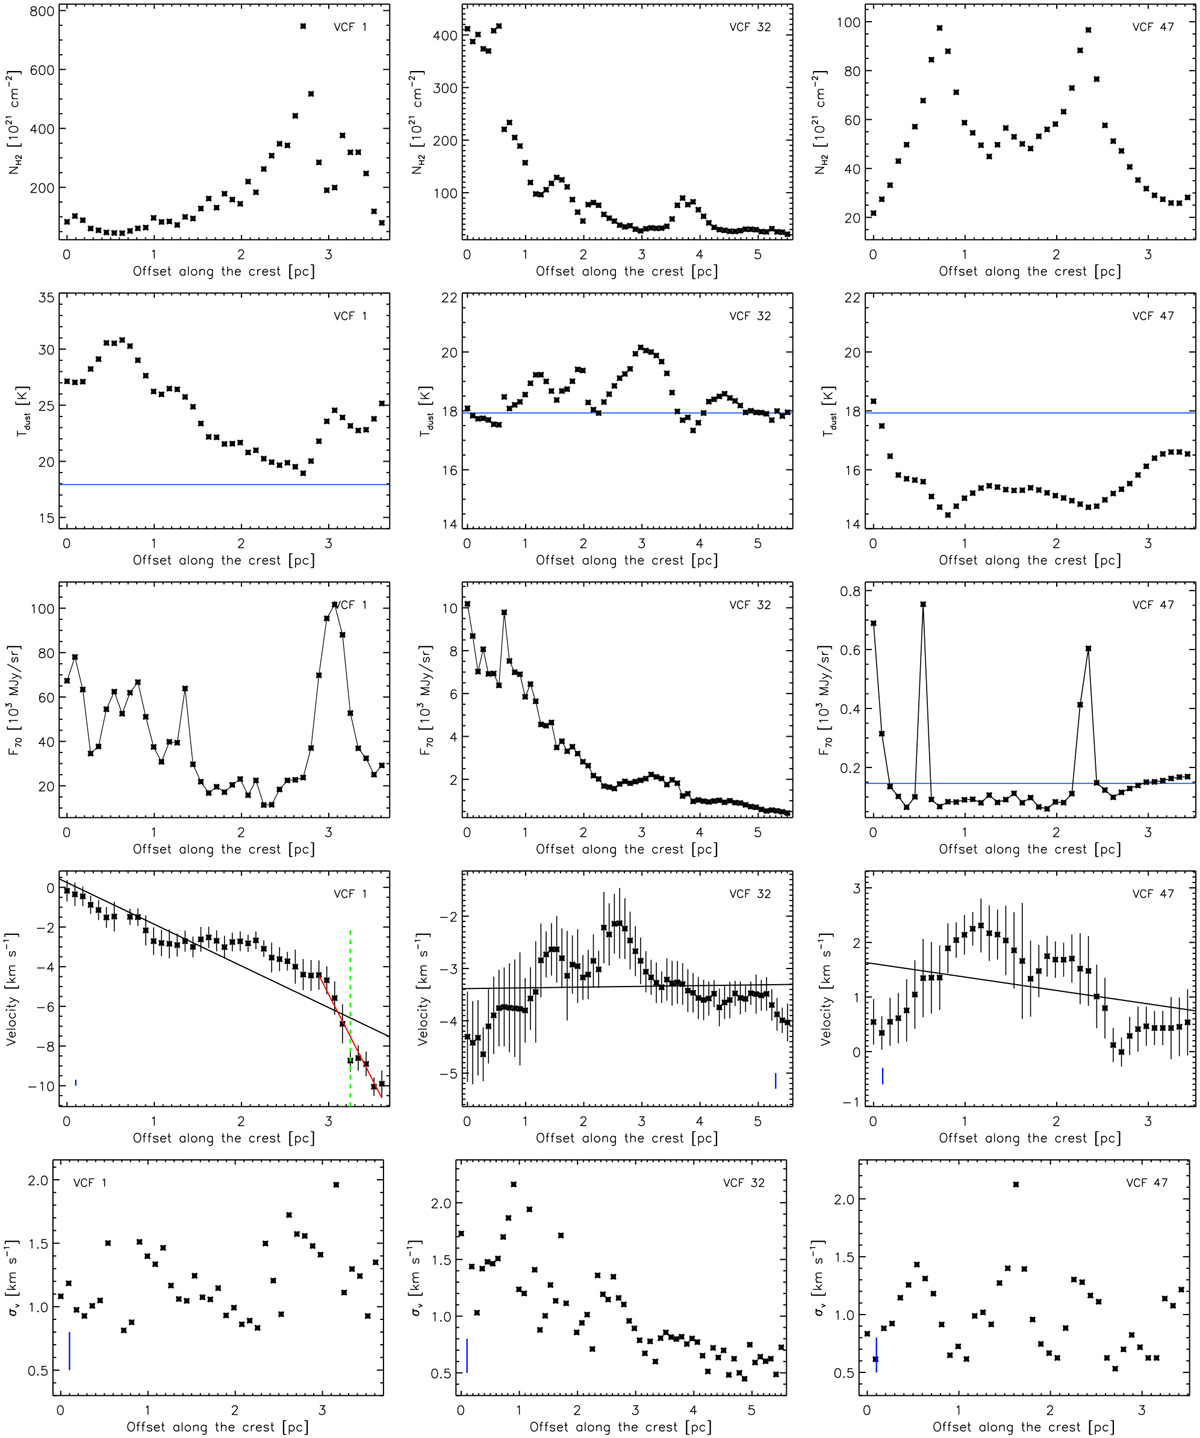
Properties along VCF crests 1, 32, and 47 (from left to right). The zero offsets correspond to the most southwestern end of the crests (as seen on Fig. 6). Rows from top to bottom: (1) column density derived from Herschel data. (2) LOS averaged dust temperature derived from Herschel data. The horizontal blue lines indicate the mean background temperature around the VFCs of ~17.9 ± 0.2 K. (3) PACS 70 µm flux. The horizontal blue line indicates the mean background emission of ~146 ± 23 MJy sr-1. (4) Velocity. The black vertical lines on each data point show the velocity dispersion (same as the values shown in row 5). The black lines show a linear fit to these data points. The velocity resolution of 0.3 km s-1 is indicated by the vertical blue lines. For VCF 1, a linear fit to the velocity >2.8 km s-1 over a length of 0.7 pc is indicated in red and corresponds to the crest crossing the young star cluster identified as source I (see, e.g., Persi & Tapia 2008). The position of source I is indicated with the vertical dashed green line (see also the green arrow in Fig. 6). (5) Velocity dispersion. The velocity resolution of 0.3km s-1 is indicated by the vertical blue lines.
Current usage metrics show cumulative count of Article Views (full-text article views including HTML views, PDF and ePub downloads, according to the available data) and Abstracts Views on Vision4Press platform.
Data correspond to usage on the plateform after 2015. The current usage metrics is available 48-96 hours after online publication and is updated daily on week days.
Initial download of the metrics may take a while.