Fig. 1
Download original image
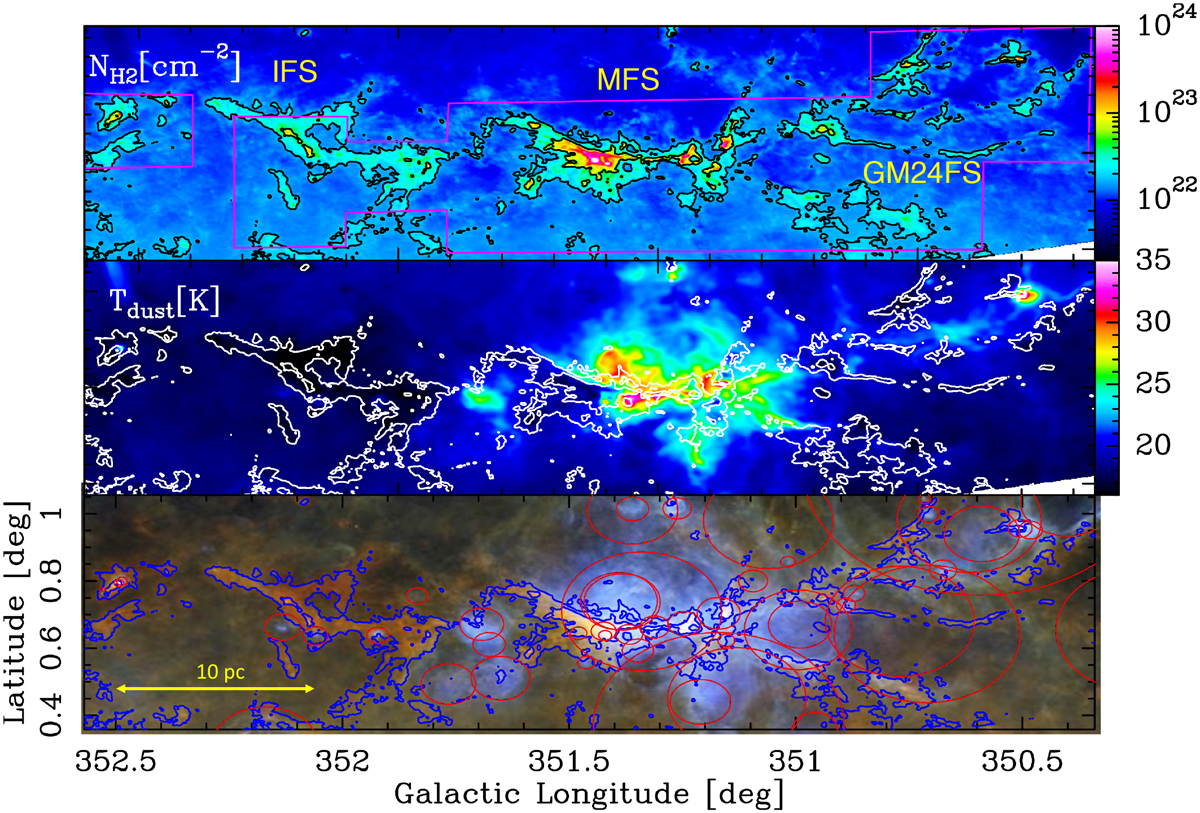
Herschel maps toward the NGC 6334 cloud. Top: column density map of the NGC 6334 cloud derived from Herschel HOBYS data (Motte et al. 2010) (see explanation in Sect. 2.4). The map is at the resolution of 18.″2 and the contours are at column densities of 1.8 and 5 × 1022 cm-2. The coverage of the APEX observations is shown in magenta. The three identified subregions are indicated (in yellow) from east to west: the inter-filament system (IFS) for 352.″3 > l > 351.″8, the main filament system (MFS) for 351.″8 > l > 351″, and the GM 24 filament system (GM24FS) for 351° > l > 350.″4. Middle: dust temperature map at 36.″3 (see Sect. 2.4). The contours are the same as in the top panel. Bottom: color composite image of NGC 6334 derived from Herschel data, where the 70 µm, 160 µm, and 250 µm intensities are represented in blue, green, and red, respectively. This image is from Causi et al. (2016). The contours trace the column density as in the top panel. The red circles show the positions and sizes of the H II regions from Anderson et al. (2014) and Langston et al. (2000), and are the same as those plotted in Fig. 1 of Russeil et al. (2016).
Current usage metrics show cumulative count of Article Views (full-text article views including HTML views, PDF and ePub downloads, according to the available data) and Abstracts Views on Vision4Press platform.
Data correspond to usage on the plateform after 2015. The current usage metrics is available 48-96 hours after online publication and is updated daily on week days.
Initial download of the metrics may take a while.