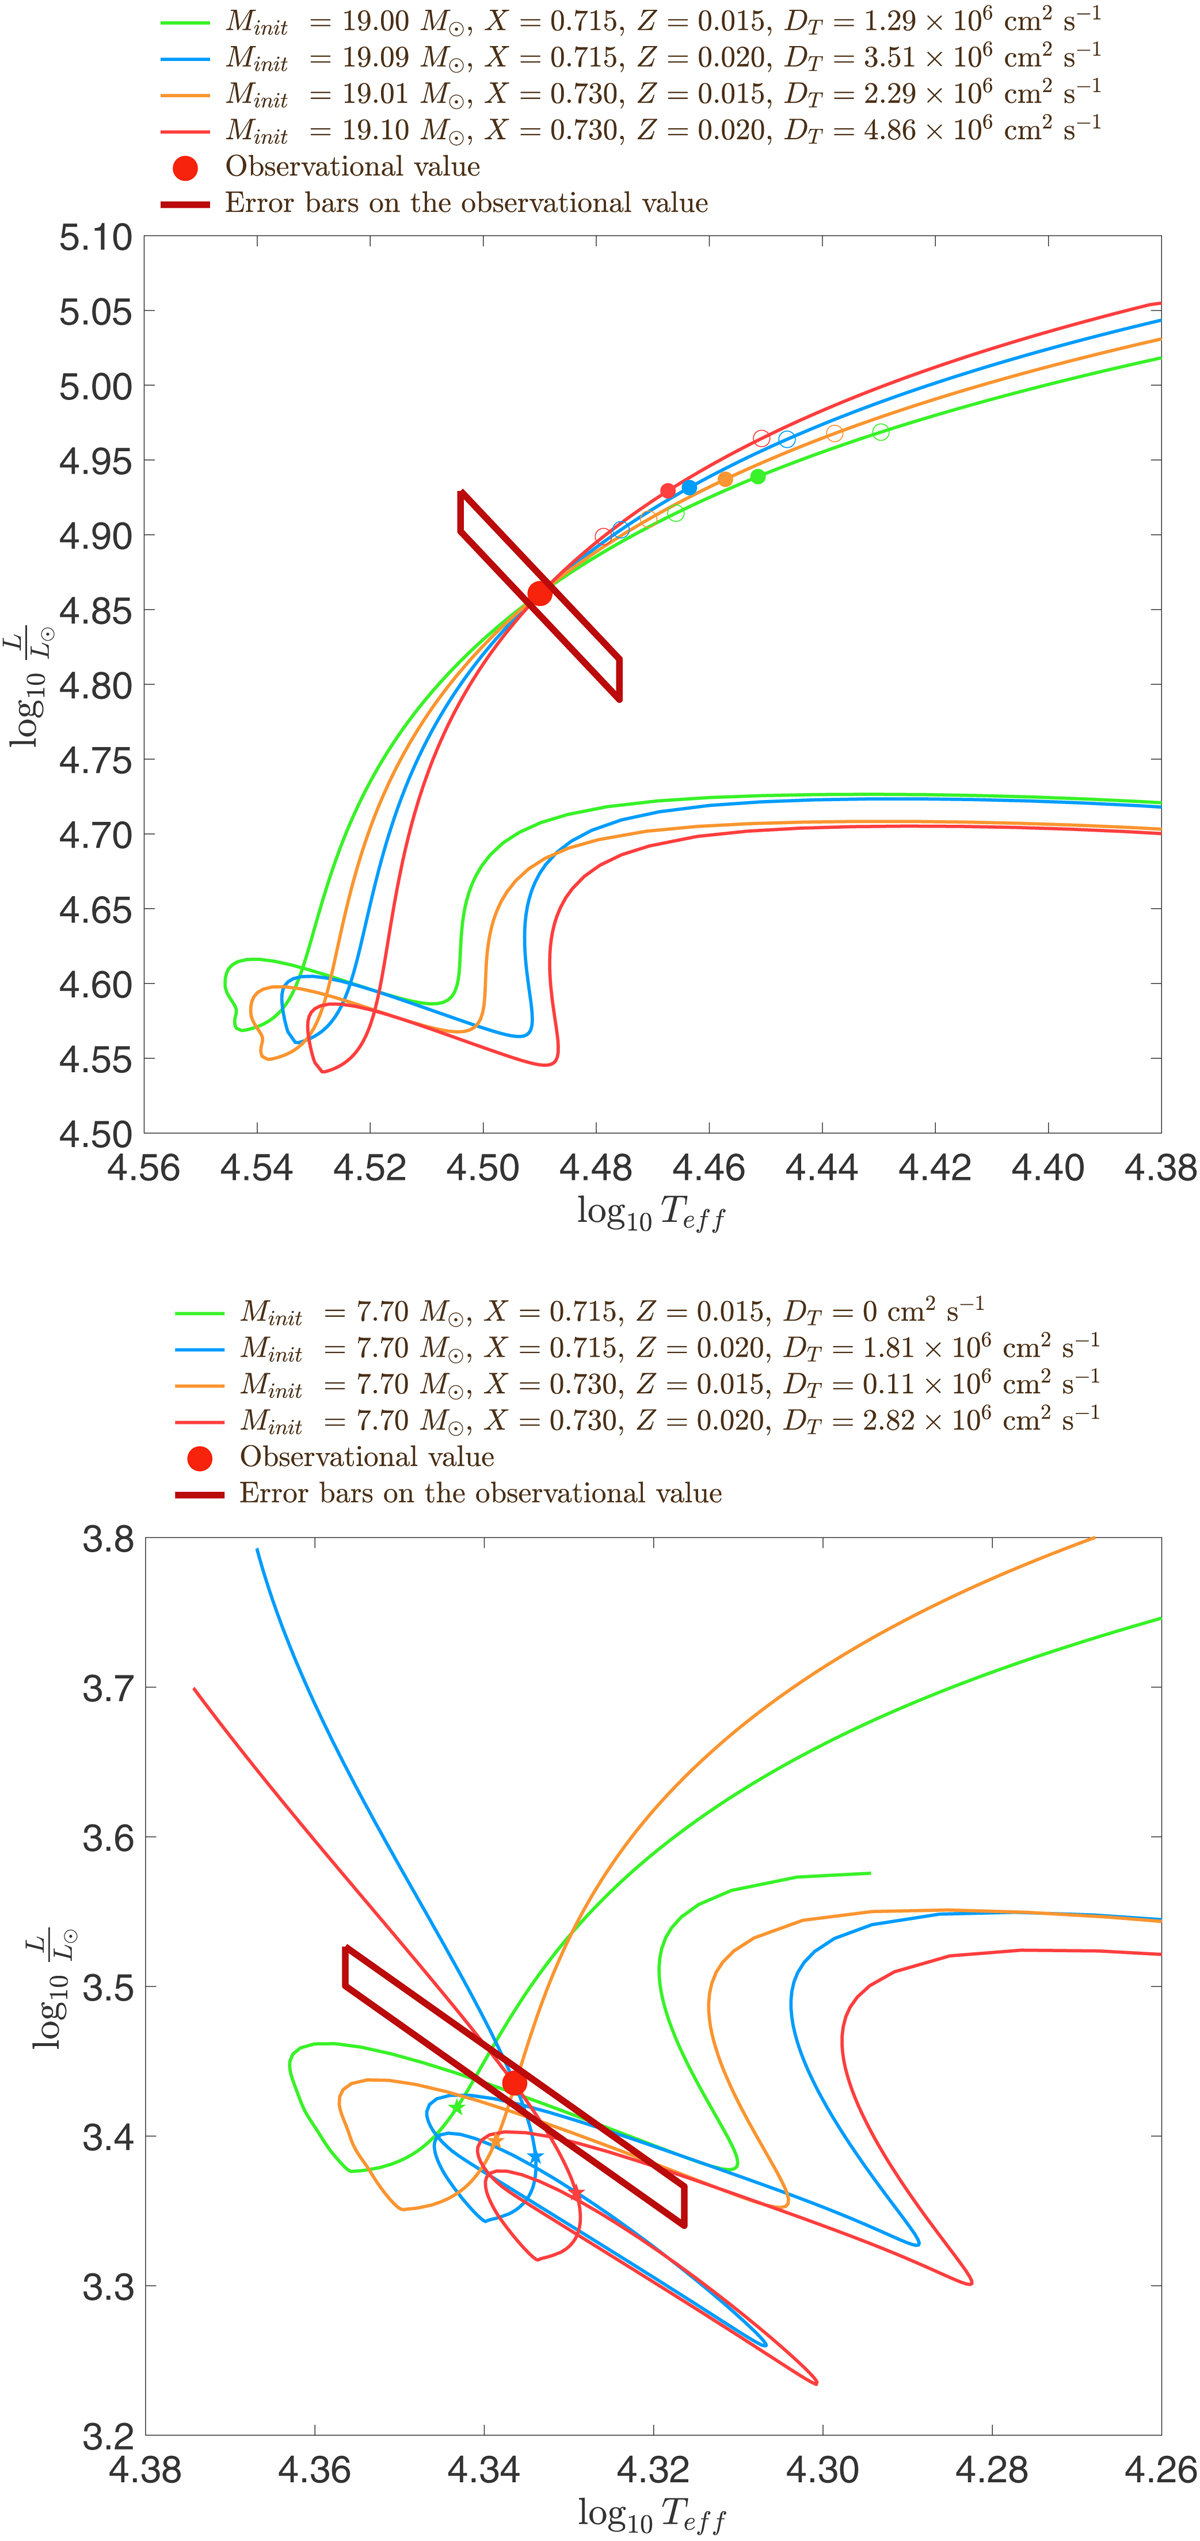
Fig. B.3.
Download original image
Hertzsprung-Russell diagram: evolutionary tracks of Clés models for the primary star (upper panel) and secondary star (lower panel) corresponding to the best-fit models listed in Table B.1 together with Series II(3) for the primary and Model IIIS for the secondary. All models have αov = 0.30, primary models have ξ = 1 while secondary models have ξ = 0.1. The dots over-plotted on the evolutionary tracks of the primary correspond to the models for which k2, 1 is equal to ![]() , while the open circles correspond to the models for which k2, 1 is equal to
, while the open circles correspond to the models for which k2, 1 is equal to ![]() . The filled 5-branch stars over-plotted on the secondary tracks correspond to the models for which the age is equal to the age of the best-fit model of the primary star of same X and Z. The observational value is represented by the red point, and its error bars are represented by the dark red parallelogram.
. The filled 5-branch stars over-plotted on the secondary tracks correspond to the models for which the age is equal to the age of the best-fit model of the primary star of same X and Z. The observational value is represented by the red point, and its error bars are represented by the dark red parallelogram.
Current usage metrics show cumulative count of Article Views (full-text article views including HTML views, PDF and ePub downloads, according to the available data) and Abstracts Views on Vision4Press platform.
Data correspond to usage on the plateform after 2015. The current usage metrics is available 48-96 hours after online publication and is updated daily on week days.
Initial download of the metrics may take a while.