Fig. 19.
Download original image
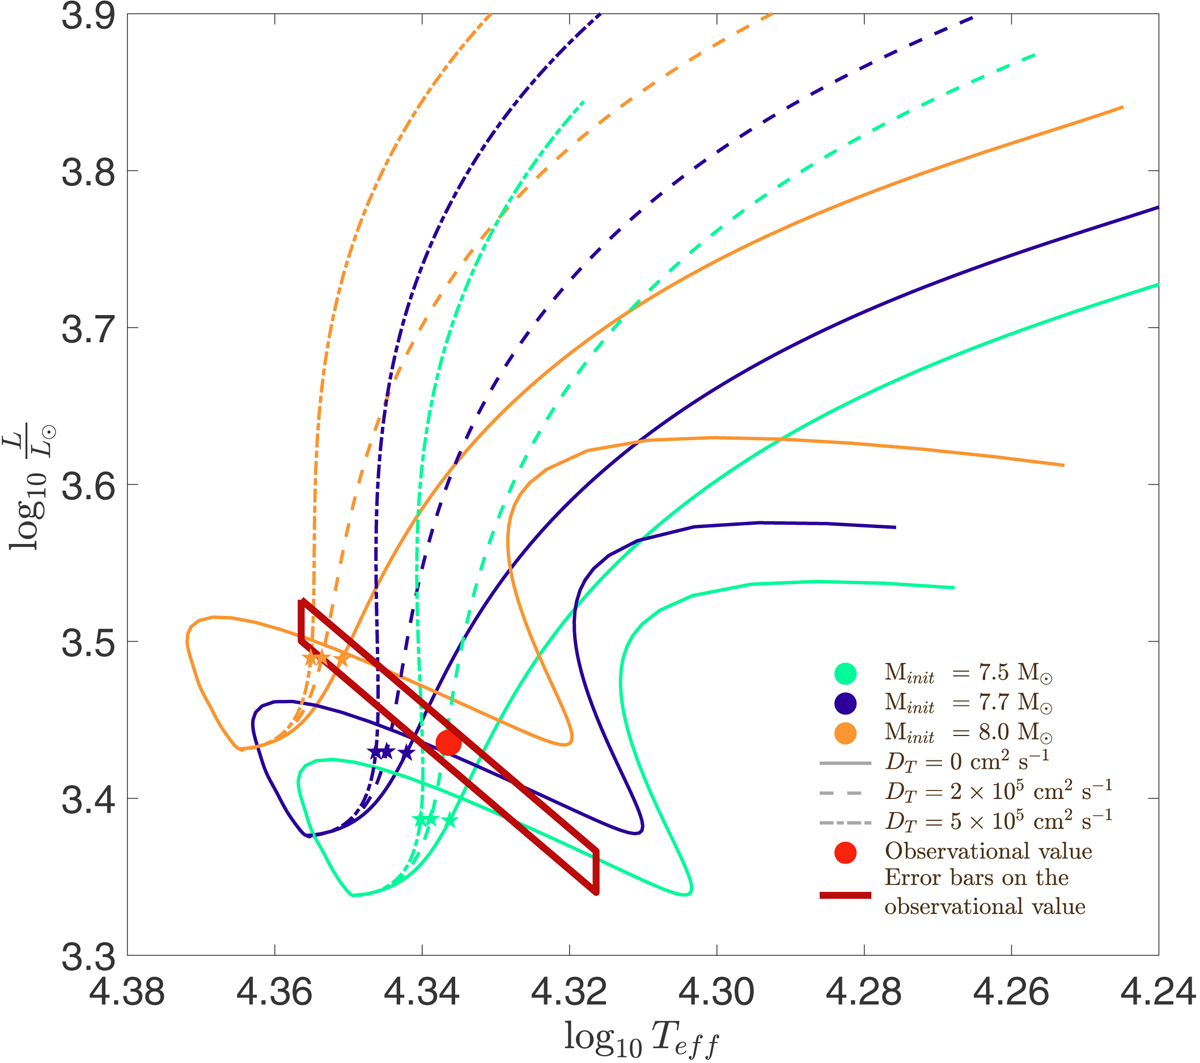
Hertzsprung-Russell diagram: evolutionary tracks of Clés models for the secondary star of Minit = 7.5 M⊙ (water green), 7.7 M⊙ (dark blue), and 8.0 M⊙ (orange), and DT = 0 cm2 s−1 (solid line), 2 × 105 cm2 s−1 (dashed line), and 5 × 105 cm2 s−1 (dotted-dashed line). All models have αov = 0.30 and ξ = 0.1. The filled 5-branch stars over-plotted on the tracks correspond to the models for which the age is equal to the age of the best-fit models of the primary star (i.e. about 9 Myr). The observational value is represented by the red point, and its error bars are represented by the dark red parallelogram.
Current usage metrics show cumulative count of Article Views (full-text article views including HTML views, PDF and ePub downloads, according to the available data) and Abstracts Views on Vision4Press platform.
Data correspond to usage on the plateform after 2015. The current usage metrics is available 48-96 hours after online publication and is updated daily on week days.
Initial download of the metrics may take a while.