Fig. 18.
Download original image
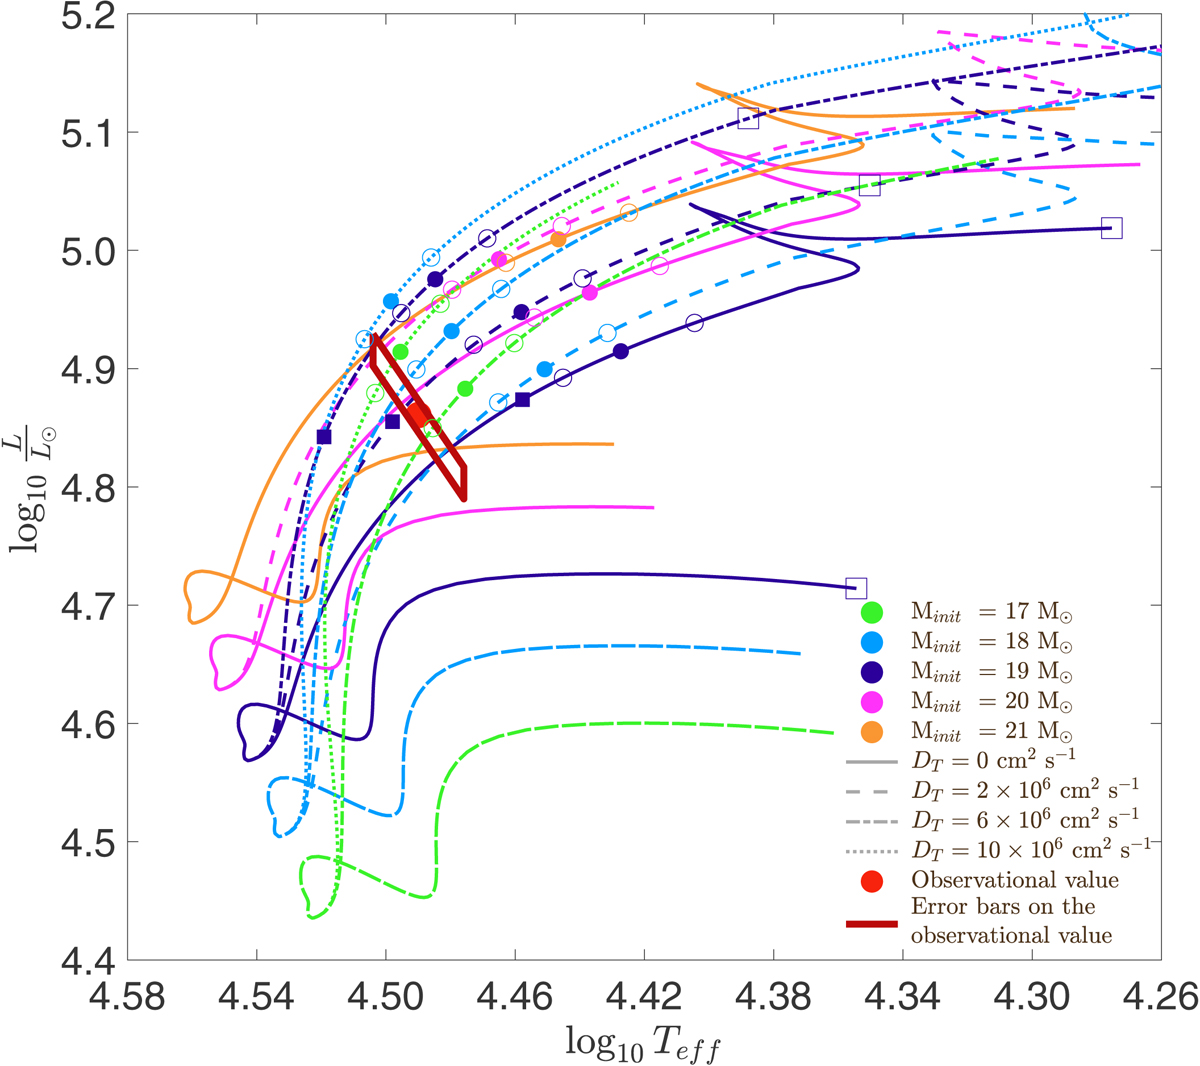
Hertzsprung-Russell diagram: evolutionary tracks of Clés models for the primary star of Minit = 17 M⊙ (green), 18 M⊙ (light blue), 19 M⊙ (dark blue), 20 M⊙ (pink), and 21 M⊙ (orange), and DT = 0 cm2 s−1 (solid line), 2 × 106 cm2 s−1 (dashed line), 6 × 106 cm2 s−1 (dotted-dashed line), and 10 × 106 cm2 s−1 (dotted line). All models have αov = 0.30 and ξ = 1. The dots over-plotted on the corresponding tracks correspond to the models for which k2, 1 is equal to ![]() , while the open circles correspond to the models for which k2, 1 is equal to
, while the open circles correspond to the models for which k2, 1 is equal to ![]() . The filled and open squares over-plotted on the tracks having an initial mass of 19 M⊙ correspond to the models for which the mass equals the observational value within the error bars. The observational value is represented by the red point, and its error bars are represented by the dark red parallelogram.
. The filled and open squares over-plotted on the tracks having an initial mass of 19 M⊙ correspond to the models for which the mass equals the observational value within the error bars. The observational value is represented by the red point, and its error bars are represented by the dark red parallelogram.
Current usage metrics show cumulative count of Article Views (full-text article views including HTML views, PDF and ePub downloads, according to the available data) and Abstracts Views on Vision4Press platform.
Data correspond to usage on the plateform after 2015. The current usage metrics is available 48-96 hours after online publication and is updated daily on week days.
Initial download of the metrics may take a while.