Fig. 16.
Download original image
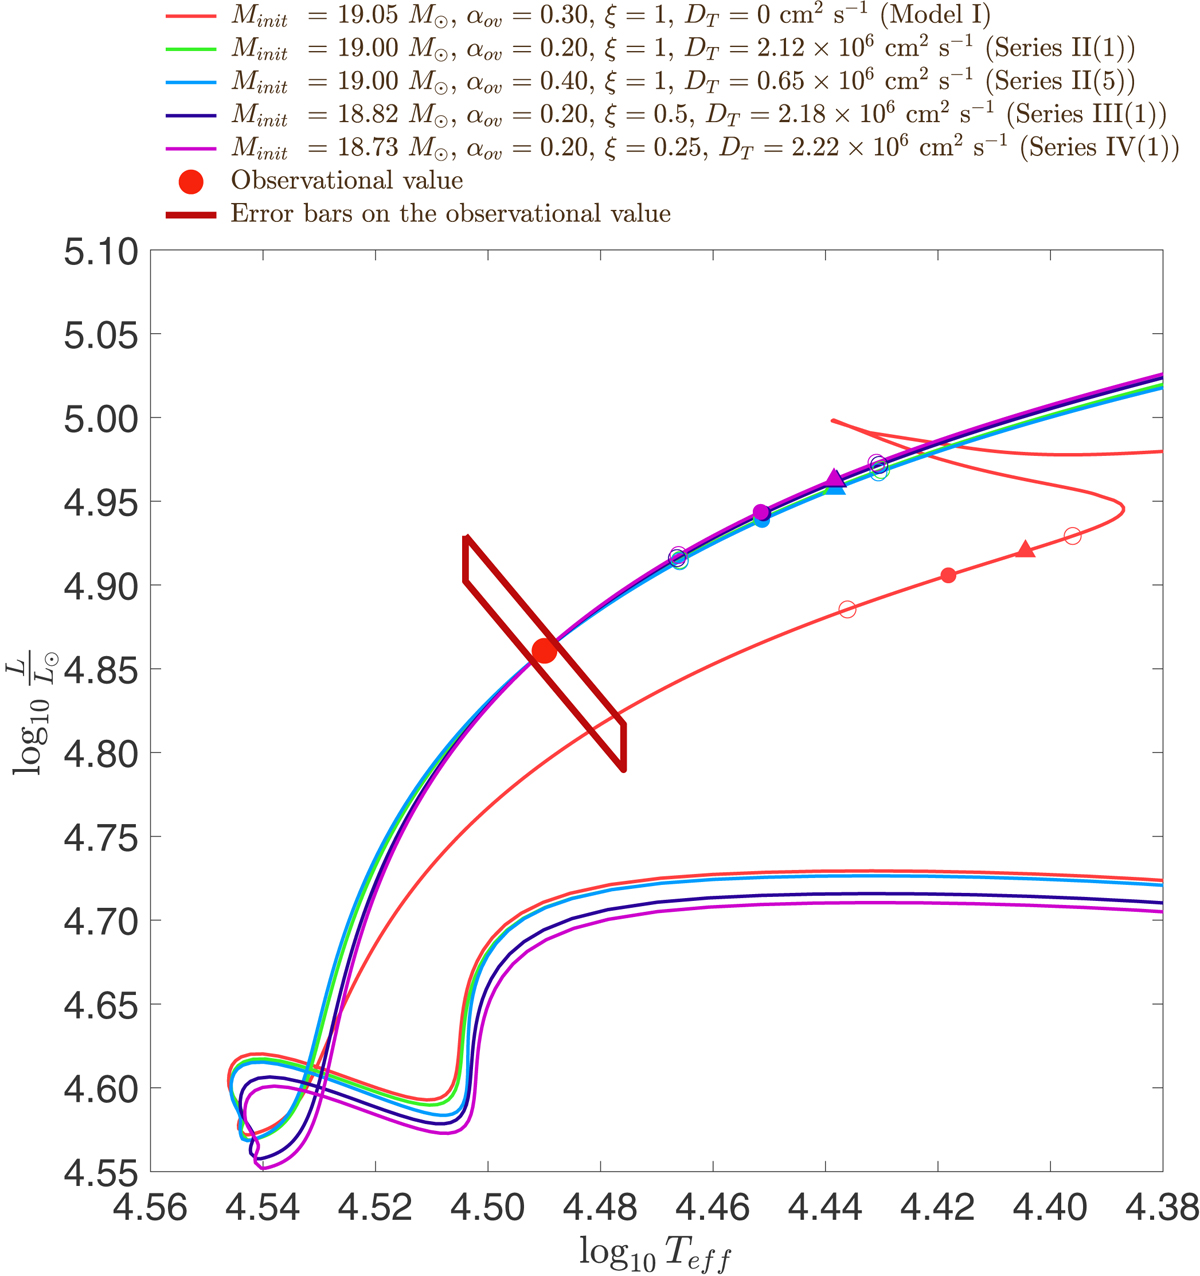
Hertzsprung-Russell diagram: evolutionary tracks of Clés models corresponding to the following best-fit models: Model I (coral), Series II(1) (green), Series II(5) (light blue), Series III(1) (dark blue), and Series IV(1) (plum). The dots and triangles over-plotted on the corresponding tracks correspond to the models for which k2, 1 is equal to ![]() and 0.00139, respectively, while the open circles correspond to the models for which k2, 1 is equal to
and 0.00139, respectively, while the open circles correspond to the models for which k2, 1 is equal to ![]() . The observational value is represented by the red point, and its error bars are represented by the dark red parallelogram.
. The observational value is represented by the red point, and its error bars are represented by the dark red parallelogram.
Current usage metrics show cumulative count of Article Views (full-text article views including HTML views, PDF and ePub downloads, according to the available data) and Abstracts Views on Vision4Press platform.
Data correspond to usage on the plateform after 2015. The current usage metrics is available 48-96 hours after online publication and is updated daily on week days.
Initial download of the metrics may take a while.