Fig. 13.
Download original image
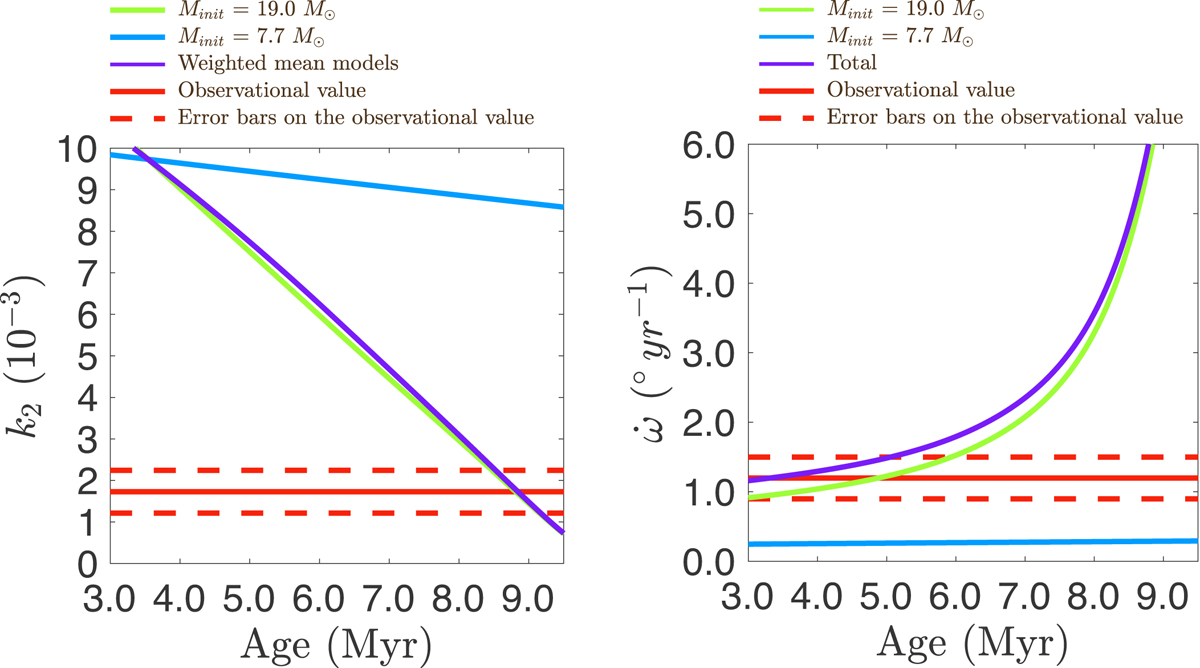
Evolution of k2 and ![]() . Left panel: evolution as a function of stellar age of the internal structure constant (to which the empirical correction Eq. (22) has been applied) for Clés models with initial mass of 19.0 M⊙ and ξ = 1 (k2, 1, green) and initial mass of 7.7 M⊙ and ξ = 0.1 (k2, 2, blue), both models have αov = 0.30 and no turbulent diffusion. The weighted-average mean of the k2-values, computed using Eq. (19), is also depicted (
. Left panel: evolution as a function of stellar age of the internal structure constant (to which the empirical correction Eq. (22) has been applied) for Clés models with initial mass of 19.0 M⊙ and ξ = 1 (k2, 1, green) and initial mass of 7.7 M⊙ and ξ = 0.1 (k2, 2, blue), both models have αov = 0.30 and no turbulent diffusion. The weighted-average mean of the k2-values, computed using Eq. (19), is also depicted (![]() , purple). Right panel: evolution as a function of stellar age of the total apsidal motion rate (purple) and of the contributions of the two stars (green and blue). The observational value of the corresponding parameter and its error bars are represented by the solid red line and the dashed red horizontal lines, respectively.
, purple). Right panel: evolution as a function of stellar age of the total apsidal motion rate (purple) and of the contributions of the two stars (green and blue). The observational value of the corresponding parameter and its error bars are represented by the solid red line and the dashed red horizontal lines, respectively.
Current usage metrics show cumulative count of Article Views (full-text article views including HTML views, PDF and ePub downloads, according to the available data) and Abstracts Views on Vision4Press platform.
Data correspond to usage on the plateform after 2015. The current usage metrics is available 48-96 hours after online publication and is updated daily on week days.
Initial download of the metrics may take a while.