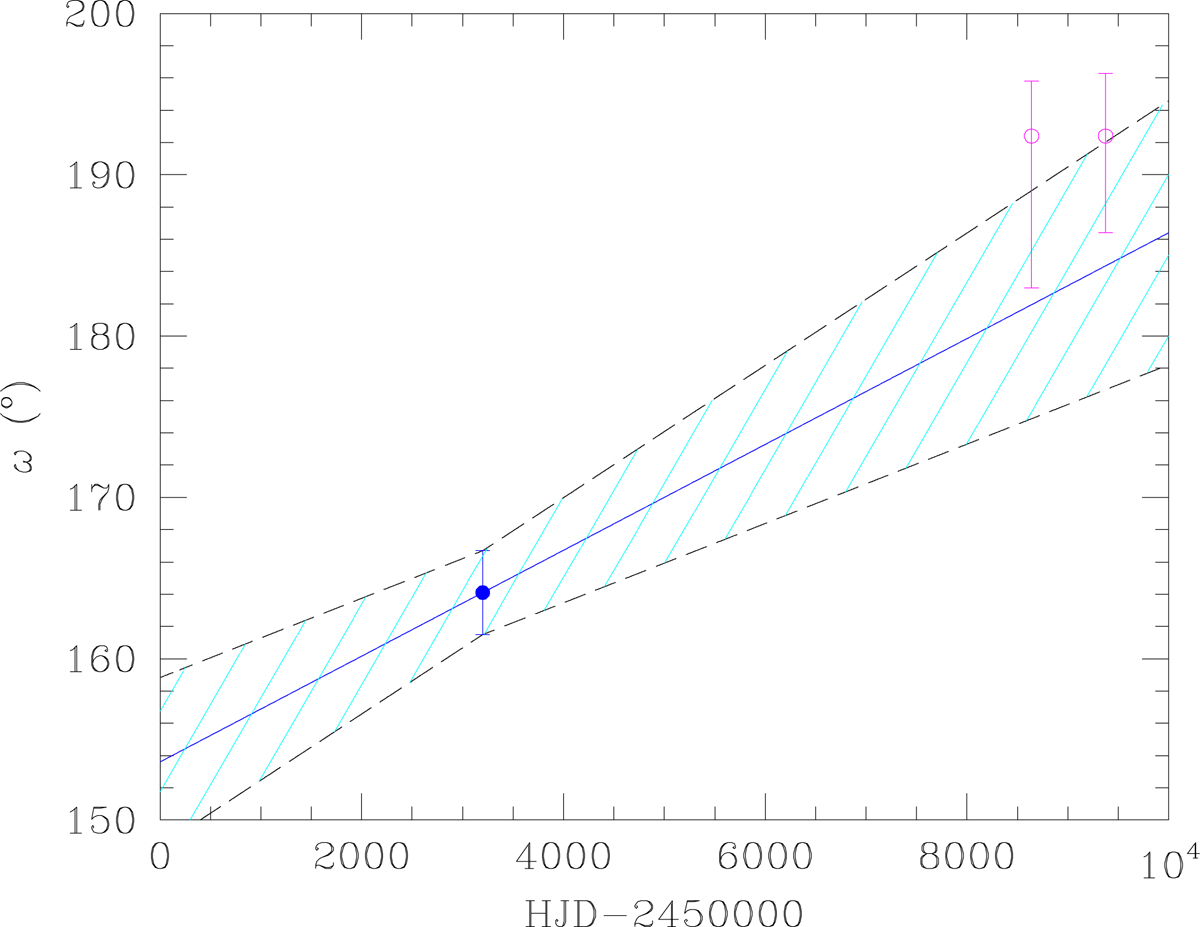
Fig. 11.
Download original image
Values of ω as a function of time inferred from the photometric light curves and the RVs. The pink symbols correspond to the data of the fits of the TESS-12 and TESS-39 photometry. The blue dot indicates the ω0 value obtained from the global fit of all RV data. The solid blue line corresponds to our best-fit value of ![]() inferred from the RVs, and the hatched cyan zone corresponds to the range of values according to the 1σ uncertainties on ω0 and
inferred from the RVs, and the hatched cyan zone corresponds to the range of values according to the 1σ uncertainties on ω0 and ![]() .
.
Current usage metrics show cumulative count of Article Views (full-text article views including HTML views, PDF and ePub downloads, according to the available data) and Abstracts Views on Vision4Press platform.
Data correspond to usage on the plateform after 2015. The current usage metrics is available 48-96 hours after online publication and is updated daily on week days.
Initial download of the metrics may take a while.