Free Access
Fig. 9.
Download original image
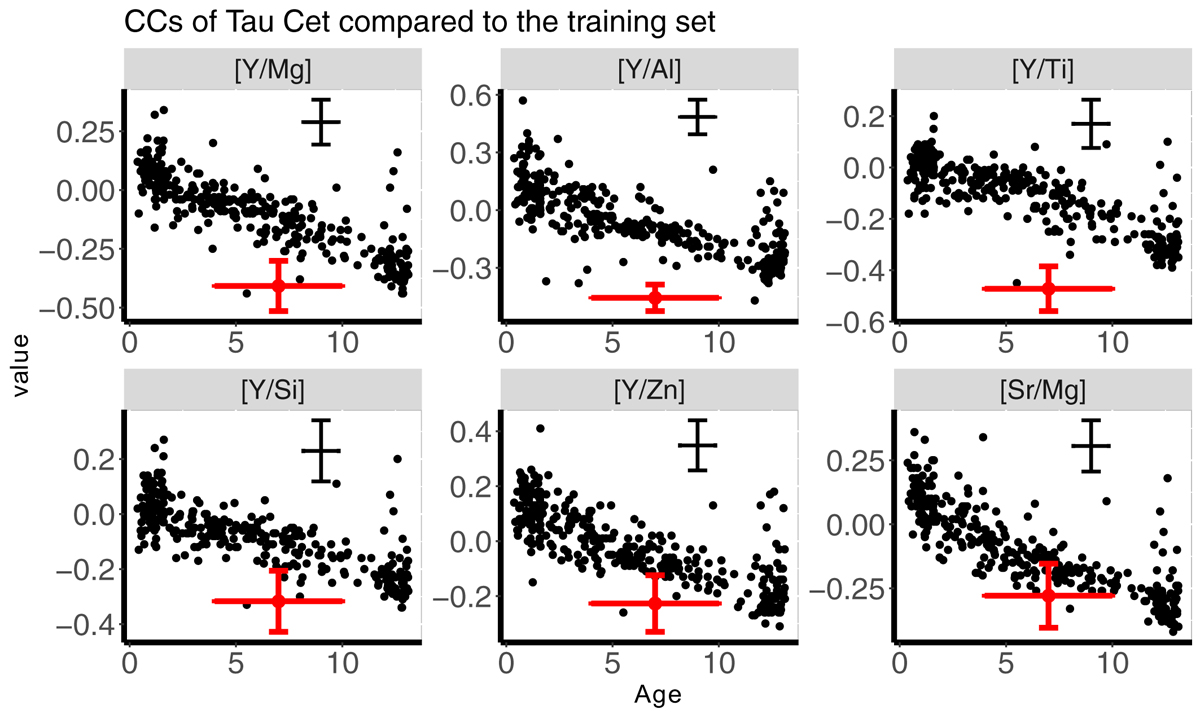
Position of the CCs of τ Cet in the CCs vs. age diagrams. Red dots are the CCs of this star. Black dots are the CCs of the training sample. The black cross represents the mean 1σ uncertainty of the training sample.
Current usage metrics show cumulative count of Article Views (full-text article views including HTML views, PDF and ePub downloads, according to the available data) and Abstracts Views on Vision4Press platform.
Data correspond to usage on the plateform after 2015. The current usage metrics is available 48-96 hours after online publication and is updated daily on week days.
Initial download of the metrics may take a while.