Free Access
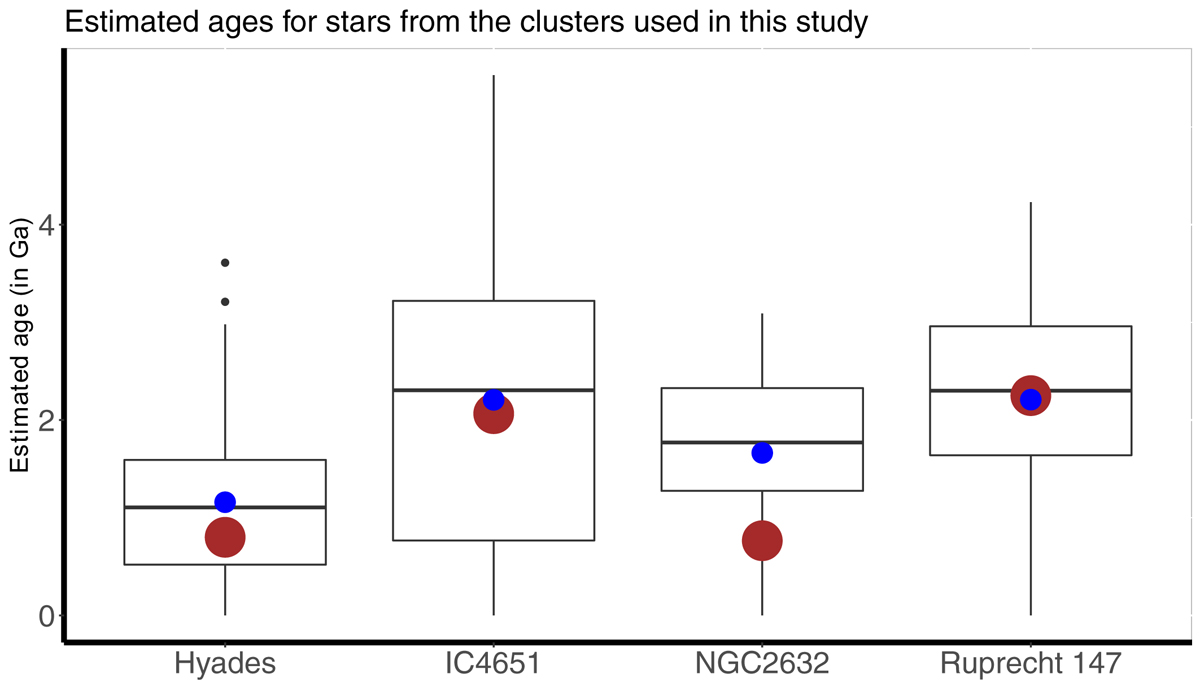
Fig. 7.
Download original image
Boxplots of the estimated age distribution for the clusters under study using our HBM. The red dots represent the literature ages of the clusters, and the blue dots show the mean ages we obtained.
Current usage metrics show cumulative count of Article Views (full-text article views including HTML views, PDF and ePub downloads, according to the available data) and Abstracts Views on Vision4Press platform.
Data correspond to usage on the plateform after 2015. The current usage metrics is available 48-96 hours after online publication and is updated daily on week days.
Initial download of the metrics may take a while.