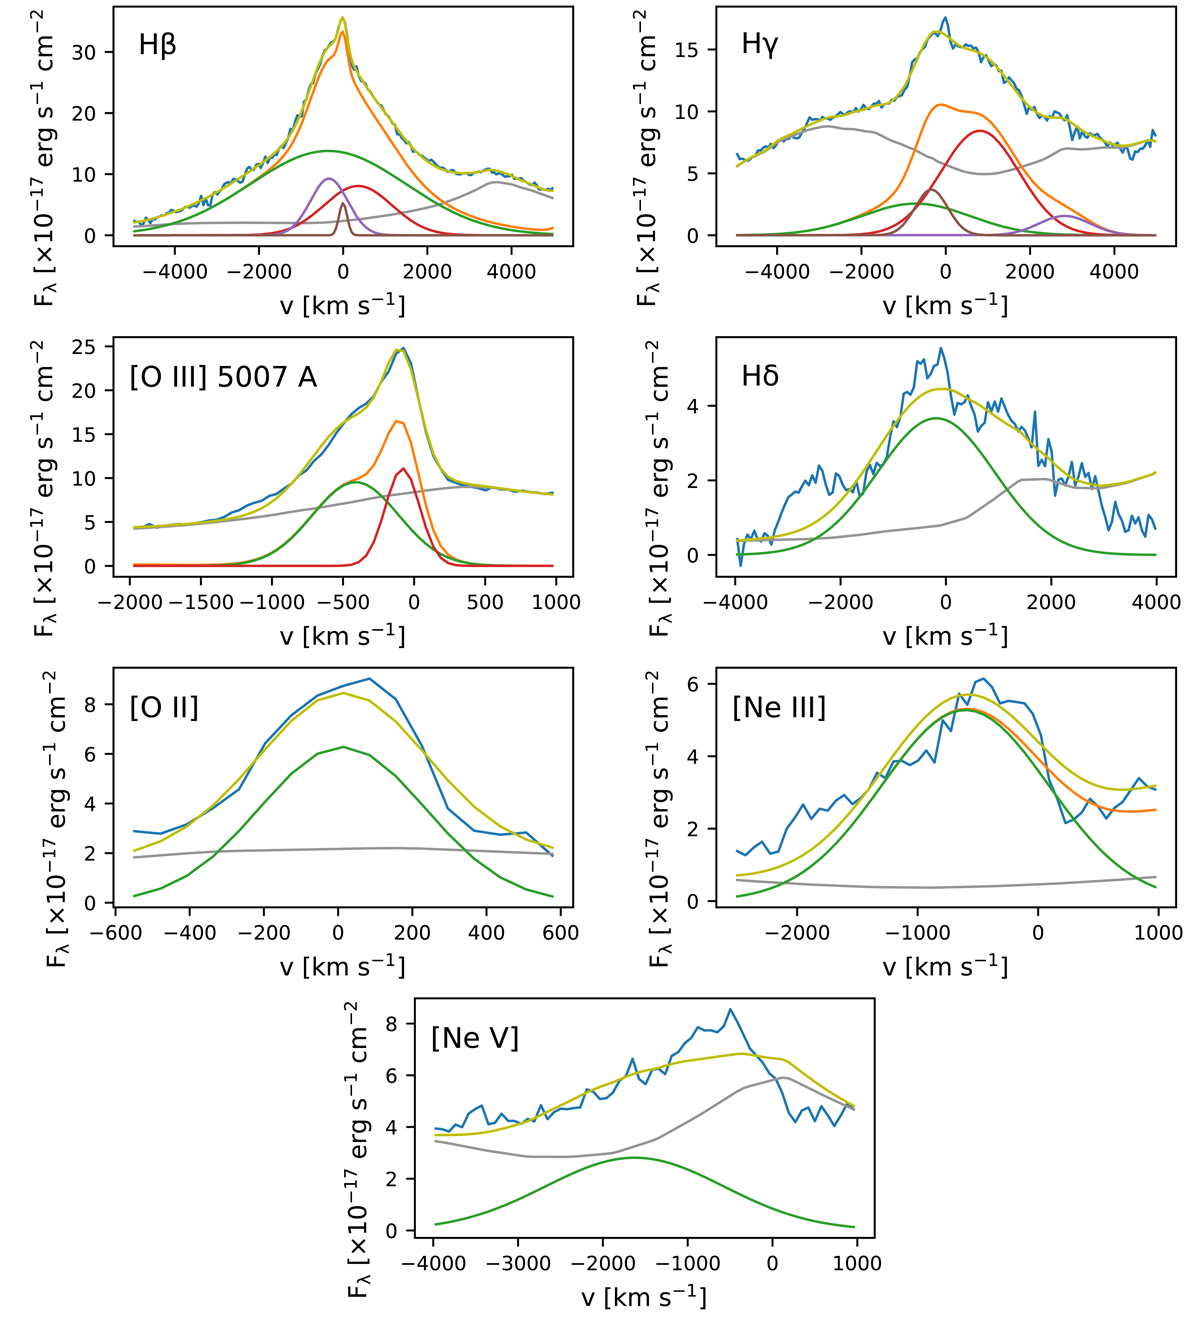
Fig. 7.
Download original image
Fitted emission lines (from top left): Hβλ4861.3 Å, Hγλ4340.4 Å, [O III] λ5006.84 Å from model B and Hδλ4101.73 Å, [O II] λ3727.3 Å, [Ne III] λ3869 Å from model W. The M1 spectrum is plotted in blue, while the model is presented as a yellow line for the sum of all components (Fe II and Gaussians) in the model. The sum of Gaussian components is shown in orange, and the separate Gaussian components are shown in green, red, violet, and brown. The Fe II template is shown in gray. Hγλ4340.4 Å is contaminated by the [O III] line, which is potentially the source of the most redshifted component (violet line in the upper right panel).
Current usage metrics show cumulative count of Article Views (full-text article views including HTML views, PDF and ePub downloads, according to the available data) and Abstracts Views on Vision4Press platform.
Data correspond to usage on the plateform after 2015. The current usage metrics is available 48-96 hours after online publication and is updated daily on week days.
Initial download of the metrics may take a while.