Fig. 5.
Download original image
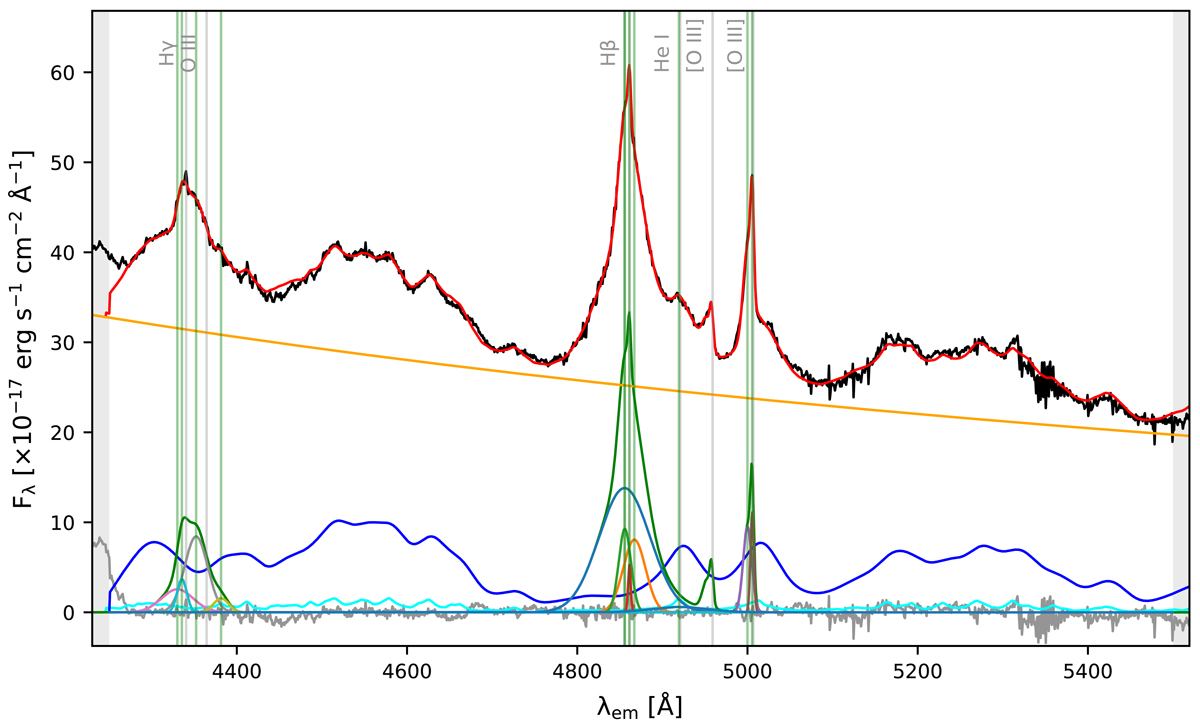
Fit to the M1 spectrum (model B), continuum fitted as a simple power law (orange) with the two components of blended Fe II emission (cyan and blue). The spectrum is plotted in black while the sum of components is presented with a red line. Overall emission line spectral profile fits are plotted in green while individual Gaussian components are presented in a range of other colors. The gray line presents the residuals. Vertical straight lines mark the expected laboratory wavelengths in gray and the fitted wavelengths in the separate components are shown in green.
Current usage metrics show cumulative count of Article Views (full-text article views including HTML views, PDF and ePub downloads, according to the available data) and Abstracts Views on Vision4Press platform.
Data correspond to usage on the plateform after 2015. The current usage metrics is available 48-96 hours after online publication and is updated daily on week days.
Initial download of the metrics may take a while.