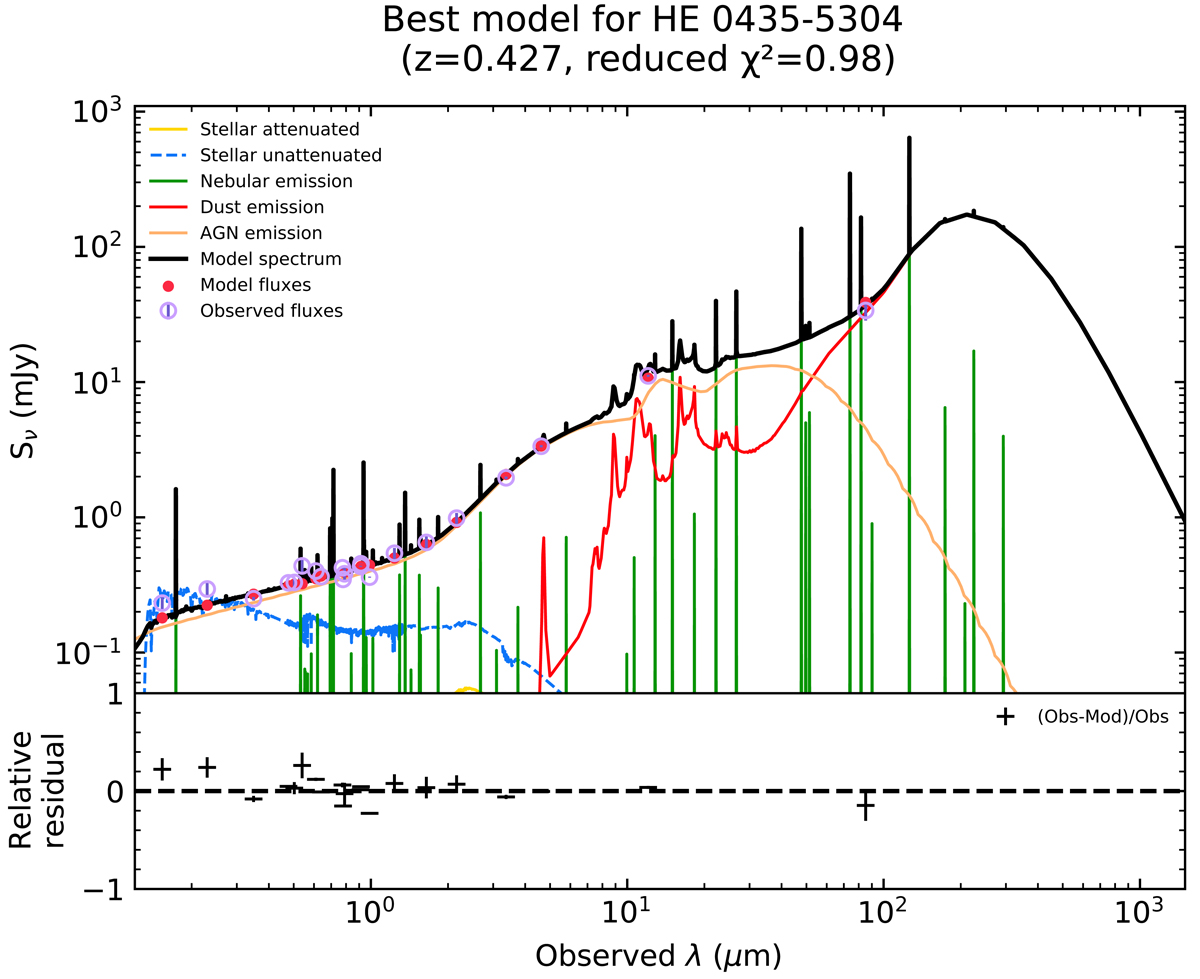
Fig. 4.
Download original image
Best fit (in black) of the constructed SEDs of HE 0435−5304 and the relative residuals. The unattenuated stellar emission is shown with the blue line, while the yellow line shows the attenuated stellar emission. Red line shows the dust emission and the broad line represents the AGN component. Red dots are the best-fit values of the observations which are shown with purple open circles.
Current usage metrics show cumulative count of Article Views (full-text article views including HTML views, PDF and ePub downloads, according to the available data) and Abstracts Views on Vision4Press platform.
Data correspond to usage on the plateform after 2015. The current usage metrics is available 48-96 hours after online publication and is updated daily on week days.
Initial download of the metrics may take a while.