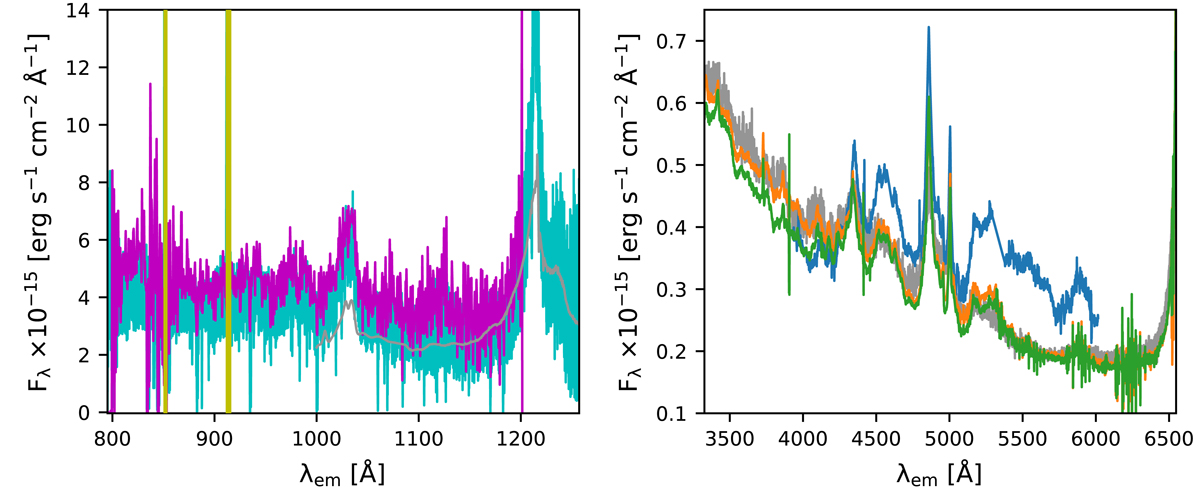
Fig. 3.
Download original image
Composite spectra of HE 0435−5304. Left panel: HST STIS spectrum in magenta, HST COS data in cyan. The yellow region masks MW emission, and the composite by Selsing et al. (2016) is shown in gray. Right panel: spectrum from SALT is plotted in blue, MUSE spectra are presented in orange and green, and the composite is shown in gray.
Current usage metrics show cumulative count of Article Views (full-text article views including HTML views, PDF and ePub downloads, according to the available data) and Abstracts Views on Vision4Press platform.
Data correspond to usage on the plateform after 2015. The current usage metrics is available 48-96 hours after online publication and is updated daily on week days.
Initial download of the metrics may take a while.