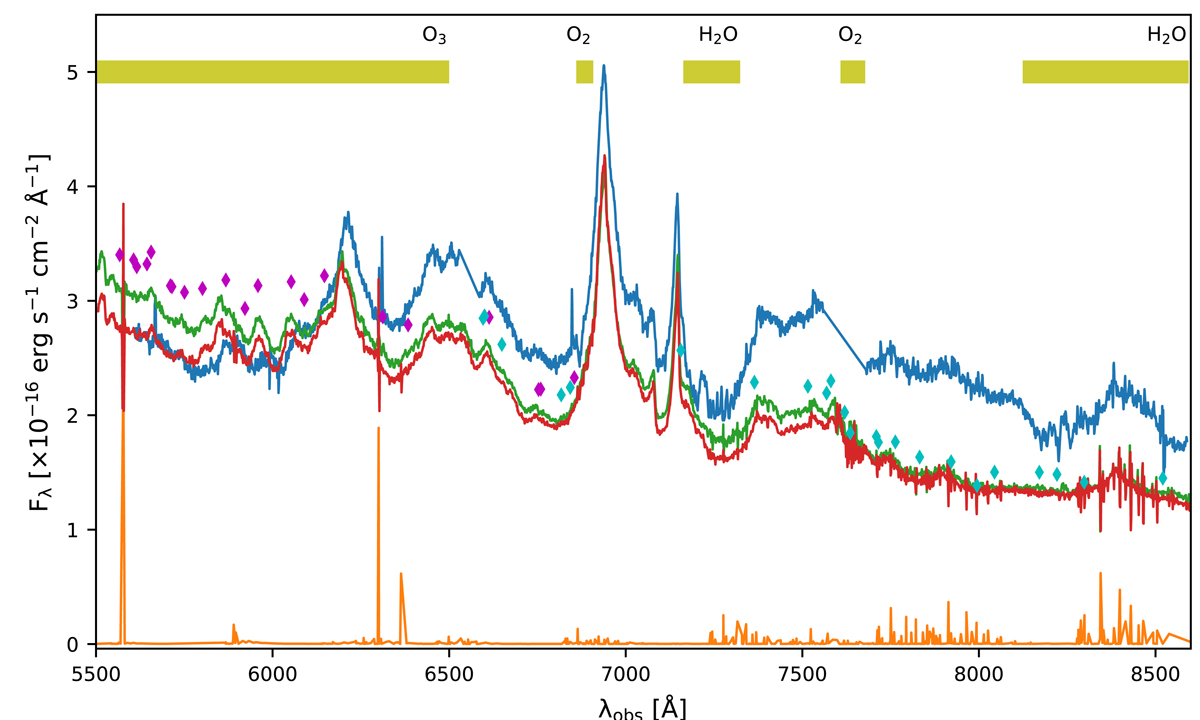
Fig. 2.
Download original image
Comparison of the optical spectra of HE 0435−5304, atmospheric emission and IGM absorption. The MUSE spectra are presented as green and red lines, while the SALT spectrum is plotted as a blue line. The spectrum from SALT is rescaled for a convenient match with the MUSE data. Sky transmission spectrum is shown as an orange line. Hypothetical Balmer absorption lines from intergalactic medium at wavelengths corresponding to Lyman lines found by Danforth et al. (2016) are marked by diamonds: cyan for Hα and magenta for Hβ.
Current usage metrics show cumulative count of Article Views (full-text article views including HTML views, PDF and ePub downloads, according to the available data) and Abstracts Views on Vision4Press platform.
Data correspond to usage on the plateform after 2015. The current usage metrics is available 48-96 hours after online publication and is updated daily on week days.
Initial download of the metrics may take a while.