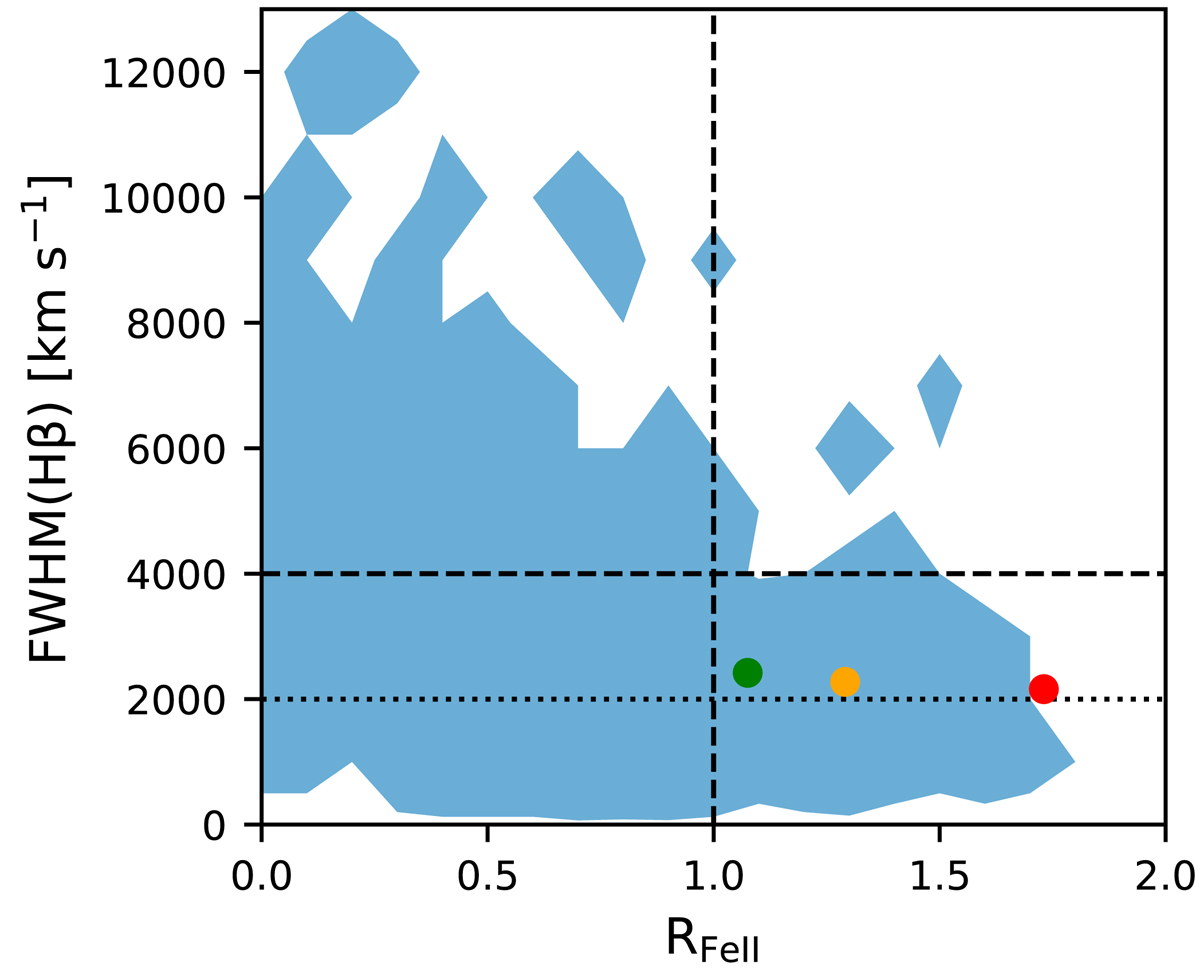
Fig. 10.
Download original image
QMS diagram with the position of HE 0435−5304 according to the fitted parameters overplotted. The blue shaded area shows the AGNs population (based on the Shen et al. 2011, catalog), while orange, green, and red points show the position of HE 0435−5304 as derived from M1, M2, and SALT spectra, respectively. The points were computed assuming a single Lorentzian component fit in Hβ and continuum + Fe II from model B. The horizontal dashed line splits the population into groups of type A (bottom) and type B (top), while the vertical dashed line divides AGNs into normal (left) and extreme (right). The dotted horizontal line divides population A into NLSy1 (FWHM < 2000 km s−1) and sources with broader lines.
Current usage metrics show cumulative count of Article Views (full-text article views including HTML views, PDF and ePub downloads, according to the available data) and Abstracts Views on Vision4Press platform.
Data correspond to usage on the plateform after 2015. The current usage metrics is available 48-96 hours after online publication and is updated daily on week days.
Initial download of the metrics may take a while.