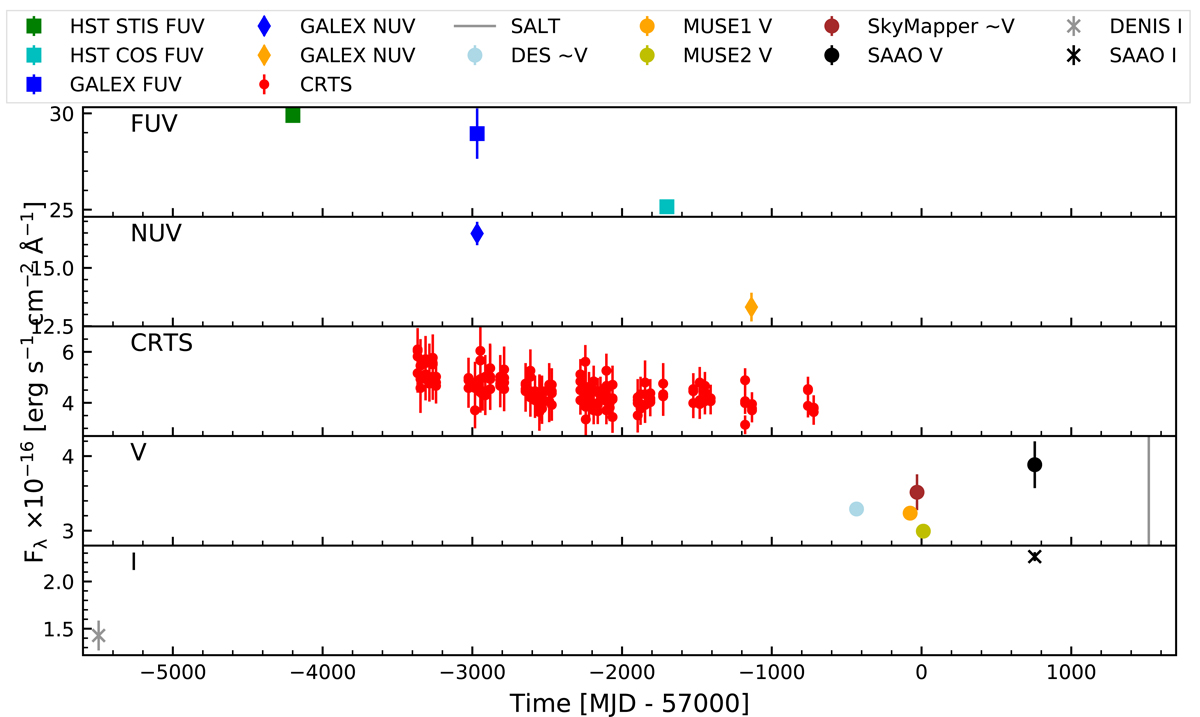
Fig. 1.
Download original image
Light curve of HE 0435−5304 built from archival data. The different panels present light curves in the different photometric bands; from top to bottom: GALEX, HST FUV and NUV; CRTS clear (unfiltered) band; and Johnson V and I. We plot GALEX FUV photometry in blue with FUV derived from HST spectra STIS in green and COS in cyan. GALEX NUV observations in the second panel are plotted in blue and orange diamonds. CRTS points are presented in red. DES is plotted in navy blue and SkyMapper in brown which are interpolated to V wavelength using neighboring filters. Both MUSE spectra (in orange and yellow) allowed us to compute V points using filter transmission curves. SALT observation date is marked with gray vertical line. SAAO in black were taken for V filter. For comparison of the epoch and flux, the IR photometry data of DENIS I (gray “x” symbols) and SAAO I (black “x” symbols) are plotted.
Current usage metrics show cumulative count of Article Views (full-text article views including HTML views, PDF and ePub downloads, according to the available data) and Abstracts Views on Vision4Press platform.
Data correspond to usage on the plateform after 2015. The current usage metrics is available 48-96 hours after online publication and is updated daily on week days.
Initial download of the metrics may take a while.