Fig. 8.
Download original image
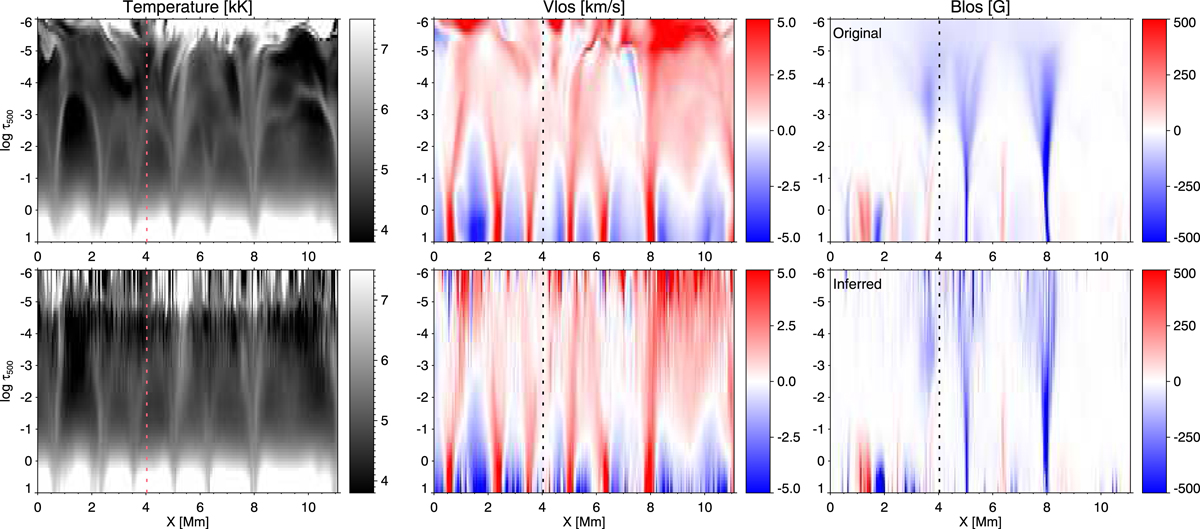
Comparison between the input atmosphere (top) and the atmosphere inferred with DeSIRe (bottom) for the inversion test described in Sect. 4.4. From left to right, we show the temperature, the LOS velocity, and the magnetic field. The FOV corresponds to the horizontal line enclosed within the squared region in Fig. 2. Abscissae correspond to the X axis in Fig. 2, and ordinates show the evolution with the height of the atmospheric parameters.
Current usage metrics show cumulative count of Article Views (full-text article views including HTML views, PDF and ePub downloads, according to the available data) and Abstracts Views on Vision4Press platform.
Data correspond to usage on the plateform after 2015. The current usage metrics is available 48-96 hours after online publication and is updated daily on week days.
Initial download of the metrics may take a while.