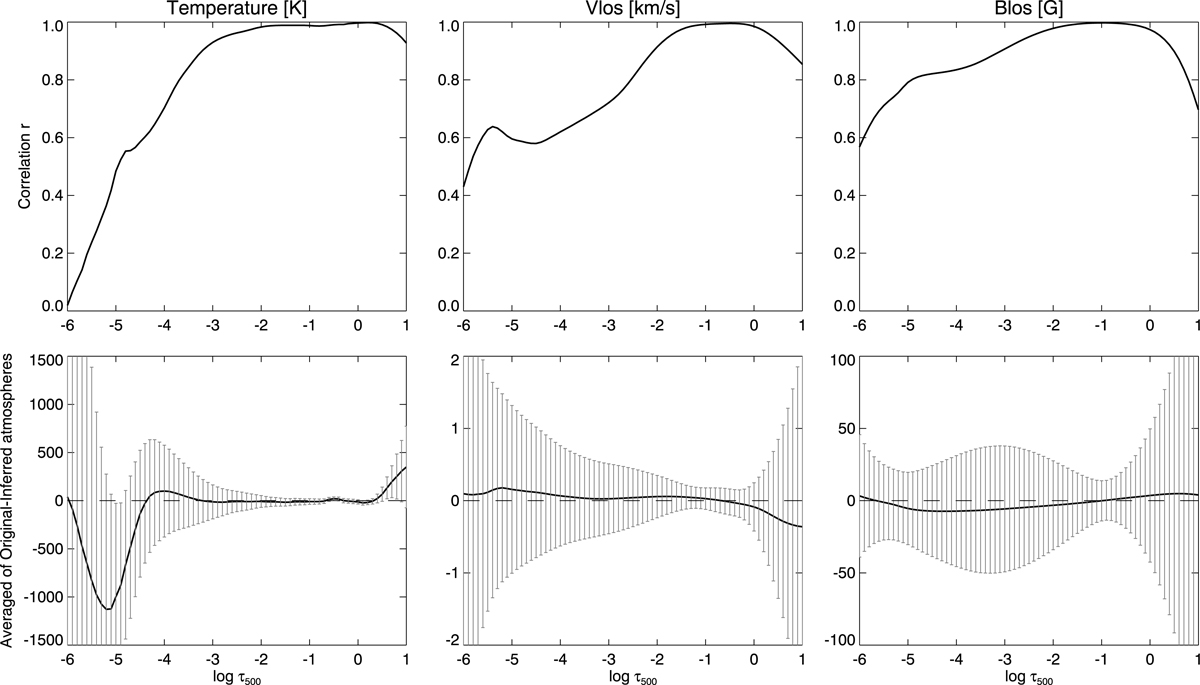
Fig. 4.
Download original image
Accuracy of the inversion code for inferring complex atmospheres. The top row displays the correlation between the input and the inferred atmospheric parameters presented in Fig. 3. The bottom row shows the average value of the difference between the input and the inferred atmosphere over the entire inverted FOV. Error bars designate the standard deviation of the difference. From left to right, columns correspond to the temperature, LOS velocity, and LOS magnetic field. Each panel displays the variation in the correlation and differences with optical depth.
Current usage metrics show cumulative count of Article Views (full-text article views including HTML views, PDF and ePub downloads, according to the available data) and Abstracts Views on Vision4Press platform.
Data correspond to usage on the plateform after 2015. The current usage metrics is available 48-96 hours after online publication and is updated daily on week days.
Initial download of the metrics may take a while.