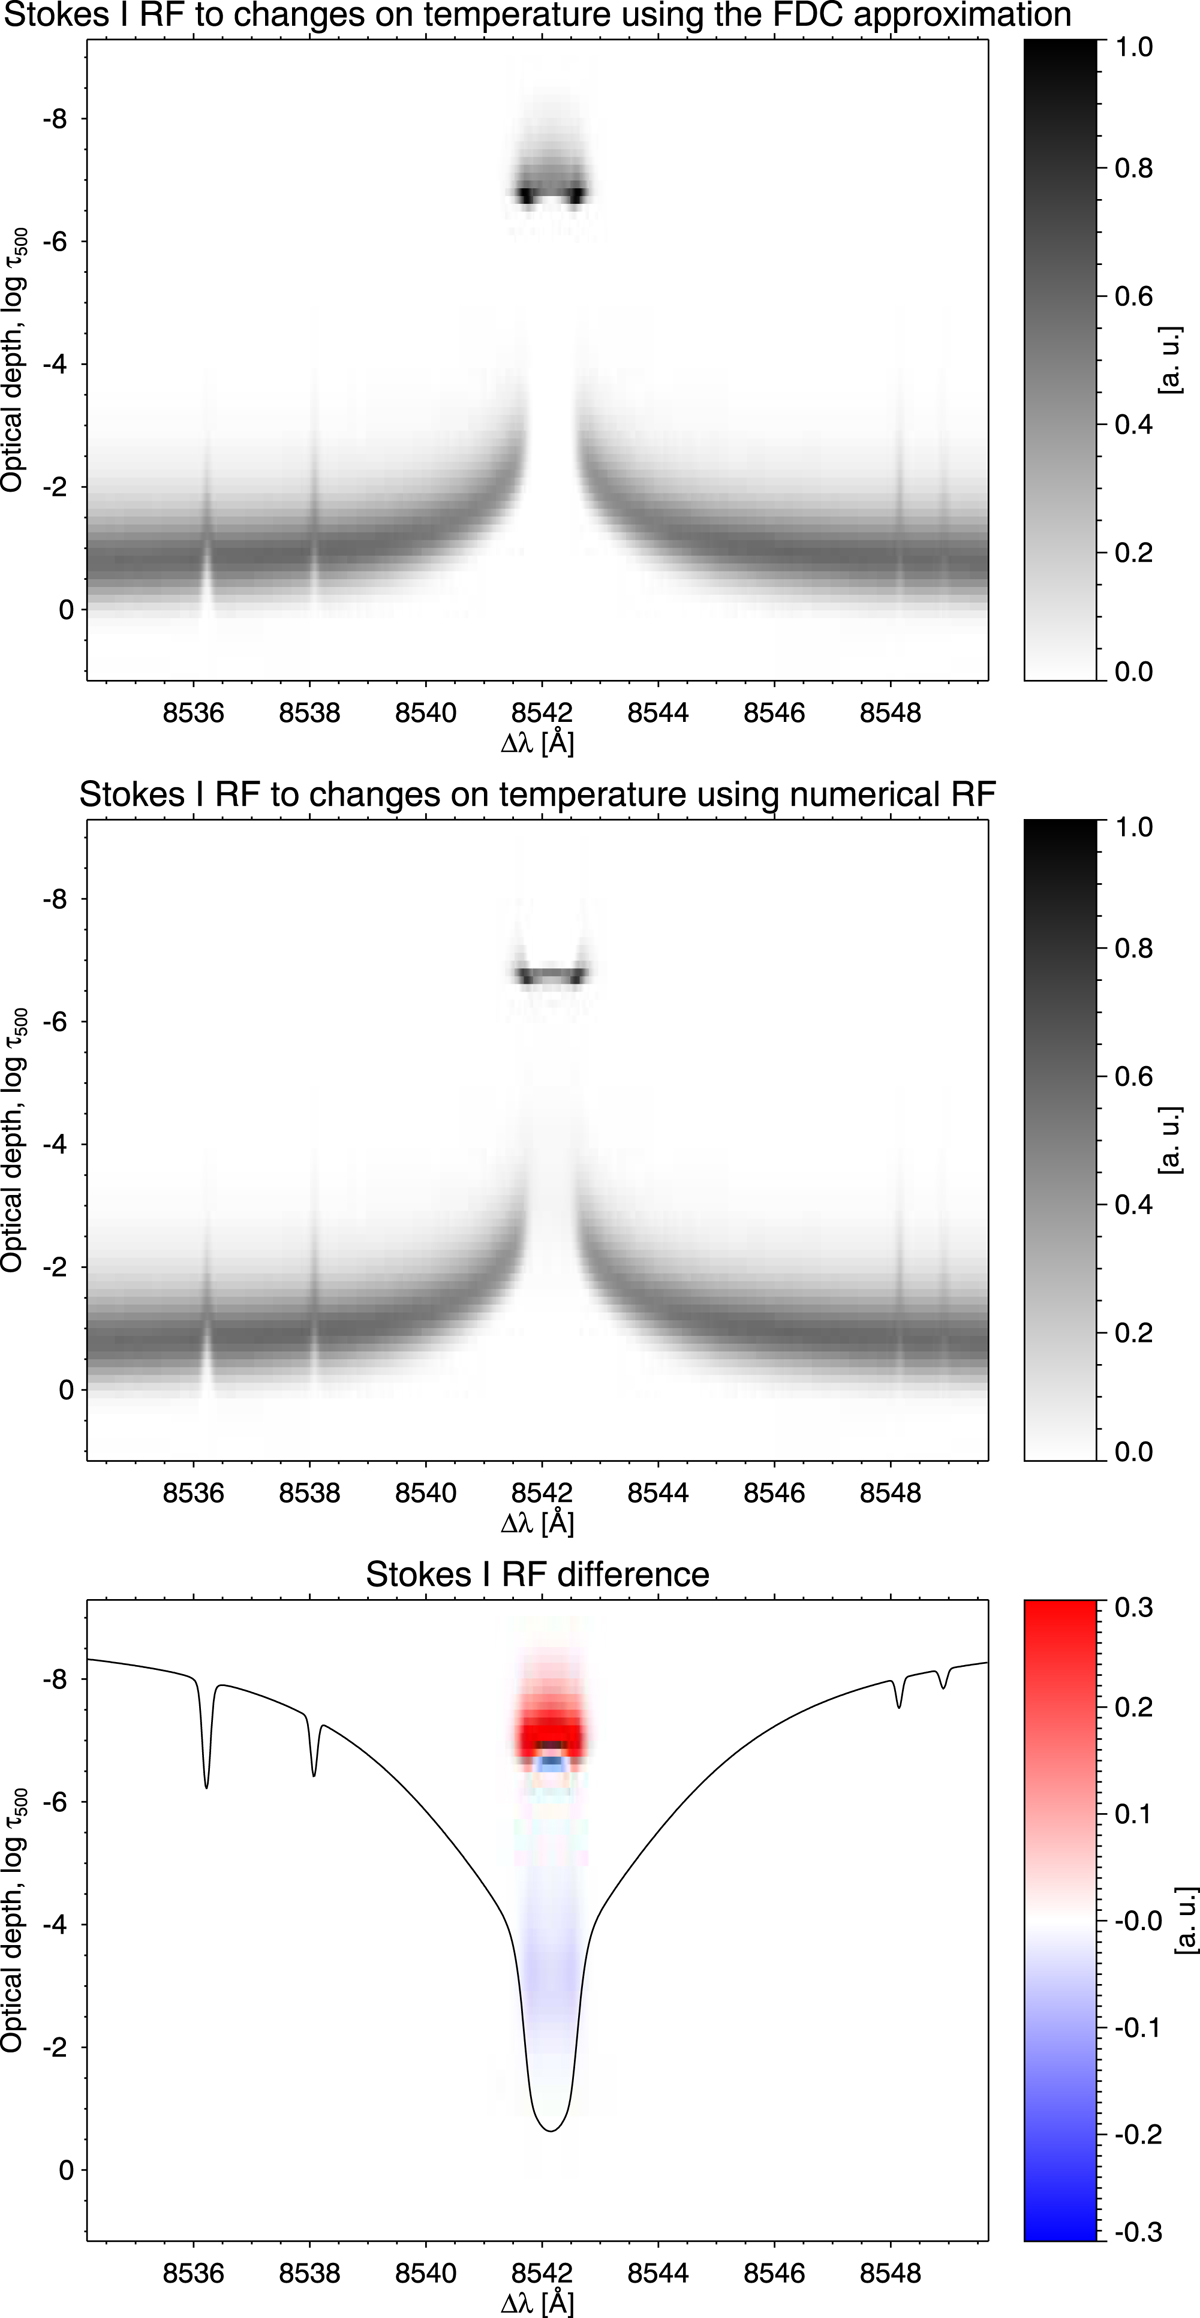
Fig. 1.
Download original image
Ca II 8542 Å Stokes I RF to changes in temperature. The top panel shows the RF computed using the FDC scheme implemented in DeSIRe, the middle panel shows the RF computed using the numerically evaluated NLTE RF, and the bottom panel displays the difference (normalised to the maximum of the numerical RF) between both computations. The intensity profile of the Ca II 8542 line is added in the bottom panel.
Current usage metrics show cumulative count of Article Views (full-text article views including HTML views, PDF and ePub downloads, according to the available data) and Abstracts Views on Vision4Press platform.
Data correspond to usage on the plateform after 2015. The current usage metrics is available 48-96 hours after online publication and is updated daily on week days.
Initial download of the metrics may take a while.