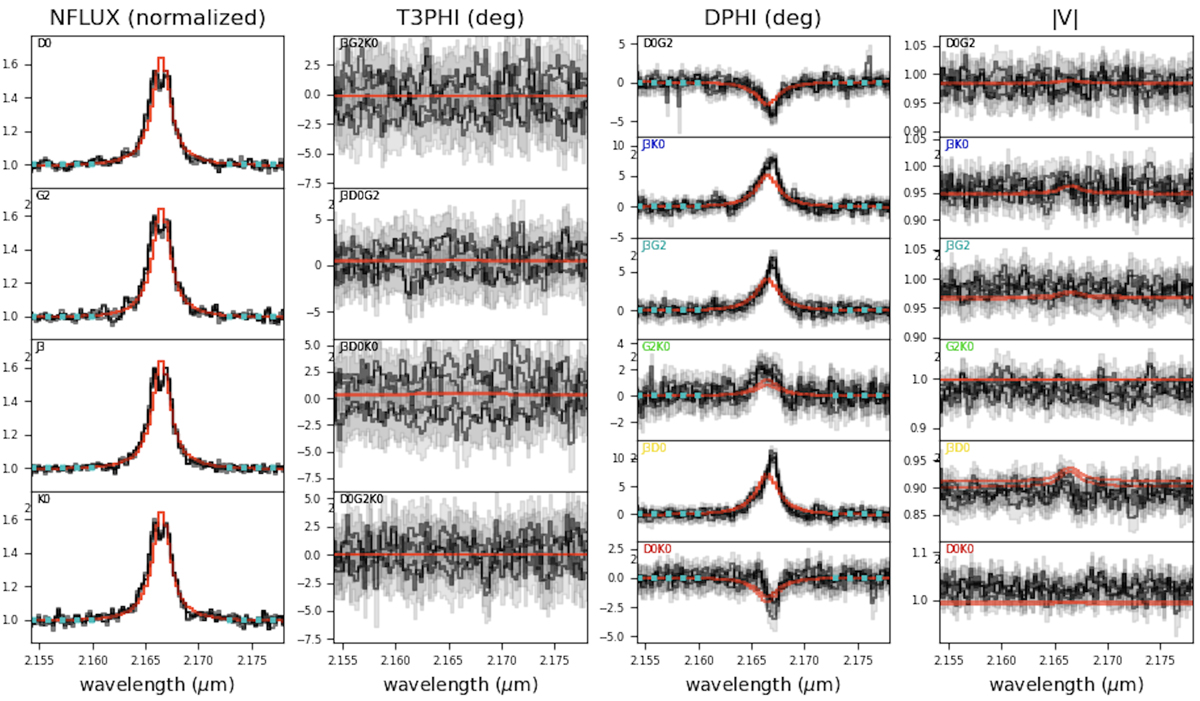
Fig. 1.
Download original image
Best fits to the GRAVITY dataset taken on September 19 2021 formed from a model composed of two point sources. The data are shown in black and the model is shown in red over a wavelength range highlighting the Brγ region as opposed to the whole GRAVITY wavelength range. In the appendices, we explain in detail how we determined this as our final fit to the data. While the different rows show different VLTI baselines (see inset labels), the different panels show the normalised flux, the closure phases, the differential phases and visibilities, from left to right. The blue dots represent the continuum.
Current usage metrics show cumulative count of Article Views (full-text article views including HTML views, PDF and ePub downloads, according to the available data) and Abstracts Views on Vision4Press platform.
Data correspond to usage on the plateform after 2015. The current usage metrics is available 48-96 hours after online publication and is updated daily on week days.
Initial download of the metrics may take a while.