Fig. C.1
Download original image
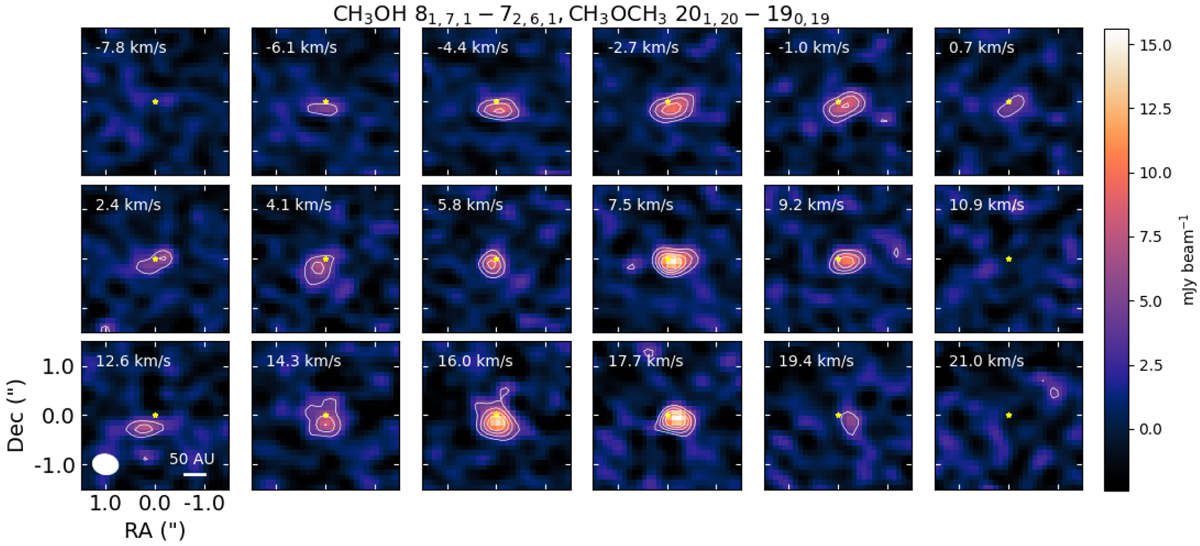
Channel maps of blended dimethyl ether and methanol lines. The first two rows show the two sets of dimethyl ether transitions while the bottom row shows emission coming from the methanol. The beam is shown in the bottom left corner and the scale bar is shown in the bottom right corner. Contours show the [3,5,7,9] × σ levels.
Current usage metrics show cumulative count of Article Views (full-text article views including HTML views, PDF and ePub downloads, according to the available data) and Abstracts Views on Vision4Press platform.
Data correspond to usage on the plateform after 2015. The current usage metrics is available 48-96 hours after online publication and is updated daily on week days.
Initial download of the metrics may take a while.