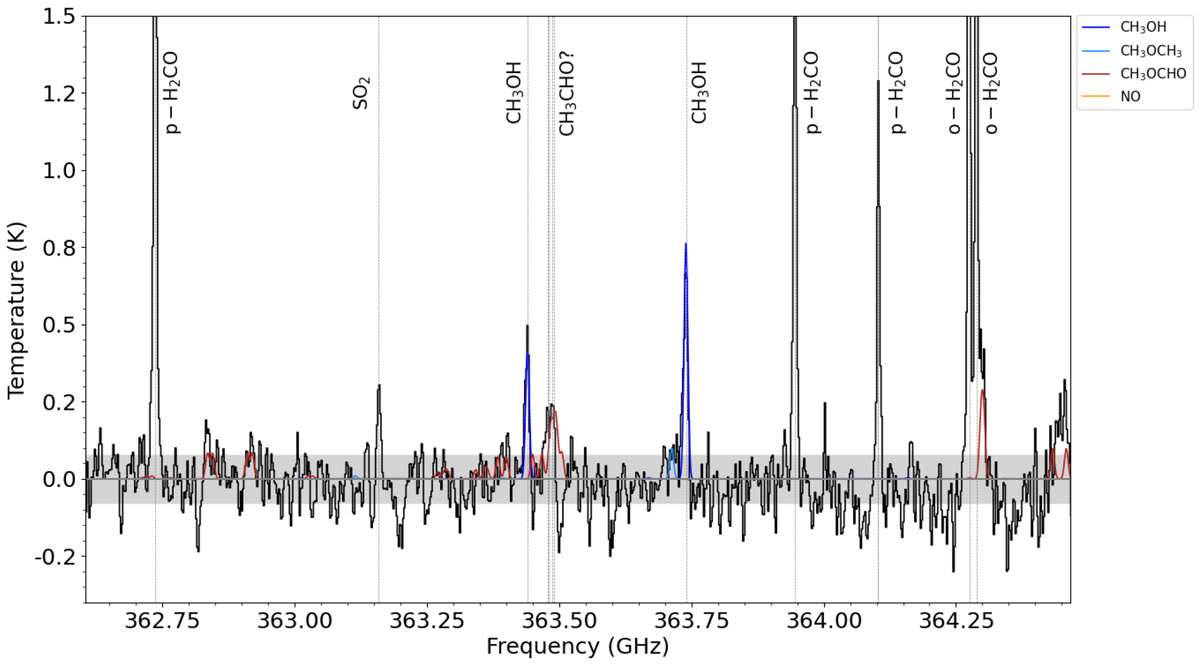
Fig. B.1
Download original image
Stacked spectra with CASSIS model fits with Tex = 100 K for all species aside from NO which is modelled at 40 K. The grey region shows the +/- 1σ error. The vertical dashed lines denote the rest frequency of the lines. The CH3OH model is with a column density of 5 × 1014 cm−2. In Fig. 2 we show how a higher column density better fits weaker CH3OH lines covered in the observations.
Current usage metrics show cumulative count of Article Views (full-text article views including HTML views, PDF and ePub downloads, according to the available data) and Abstracts Views on Vision4Press platform.
Data correspond to usage on the plateform after 2015. The current usage metrics is available 48-96 hours after online publication and is updated daily on week days.
Initial download of the metrics may take a while.