Fig. 3
Download original image
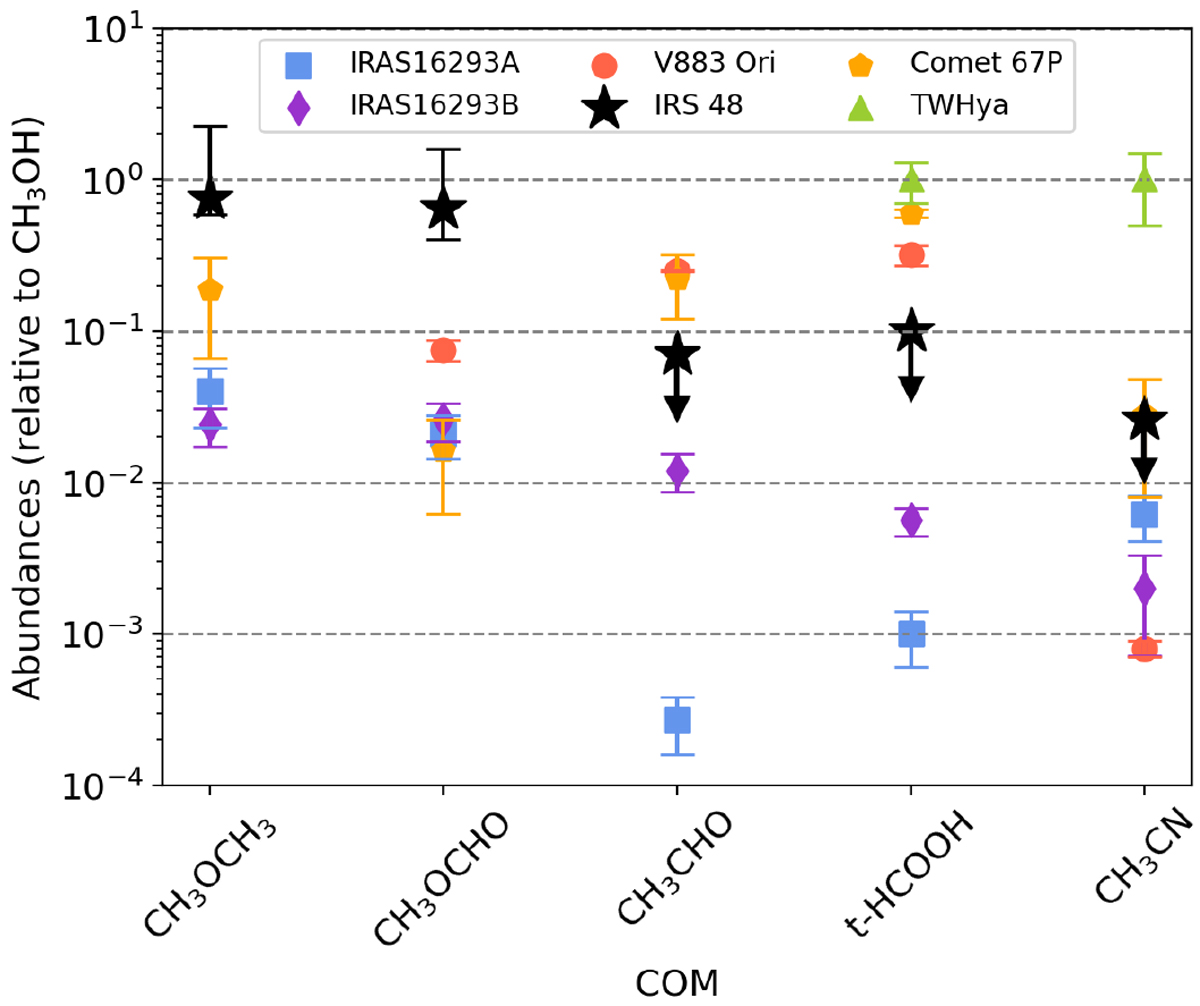
Abundances of commonly detected COMs relative to CH3OH. Solid squares show the detections in IRS 48 and arrows show the non-detected species for which upper limits on the column density are derived. The error bars on the IRS 48 points come from calculating the column densities over a range of excitation temperatures. For the other sources, see references in Sect. 4.
Current usage metrics show cumulative count of Article Views (full-text article views including HTML views, PDF and ePub downloads, according to the available data) and Abstracts Views on Vision4Press platform.
Data correspond to usage on the plateform after 2015. The current usage metrics is available 48-96 hours after online publication and is updated daily on week days.
Initial download of the metrics may take a while.