Fig. 2
Download original image
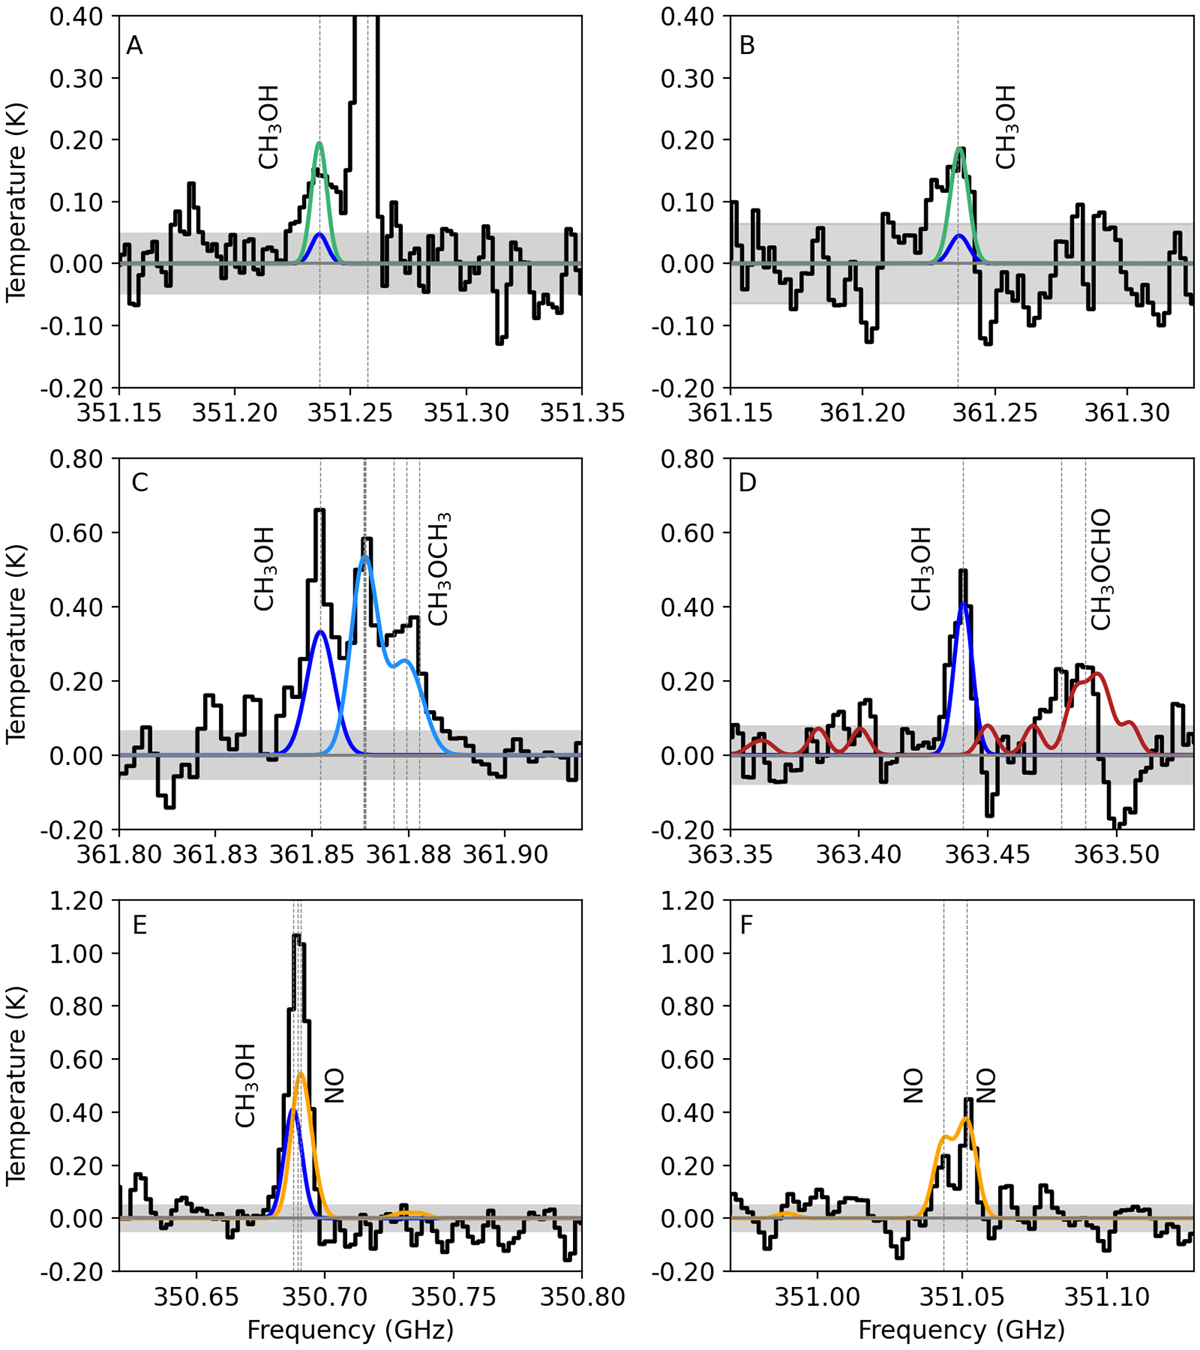
Stacked continuum-subtracted spectra (black lines) and CASSIS models (coloured lines) for the molecules detected in this work. Dashed lines mark the frequencies of the transitions as listed in Table 1 and the grey bar marks the ± 1σ error calculated from the line-free channels in each spectral window. Panels A and B: two weak CH3OH lines 9−5,4–9−4,6 and 31,2 –42,2 with the 100 K CASSIS models at 5 × 1014 cm−1 (blue) and 2 × 1015 cm−1 (green). Panels C and D: best-fit models for the CH3OCH3 201,20 –190,19 and 113,8–102,9 transitions and the CH3OCHO 323,30 –313,29 and 323,30–312,29 transitions. In panel D the negative dip in the spectrum at ≈363.5 GHz may be an atmospheric absorption feature (https://almascience.eso.org/about-alma/atmosphere-model). Panels E and F: best-fit models for NO covering the 41–43 and 41 –44 transitions. Panels C, D, and E: CH3OH model for the strong lines.
Current usage metrics show cumulative count of Article Views (full-text article views including HTML views, PDF and ePub downloads, according to the available data) and Abstracts Views on Vision4Press platform.
Data correspond to usage on the plateform after 2015. The current usage metrics is available 48-96 hours after online publication and is updated daily on week days.
Initial download of the metrics may take a while.