Fig. 1
Download original image
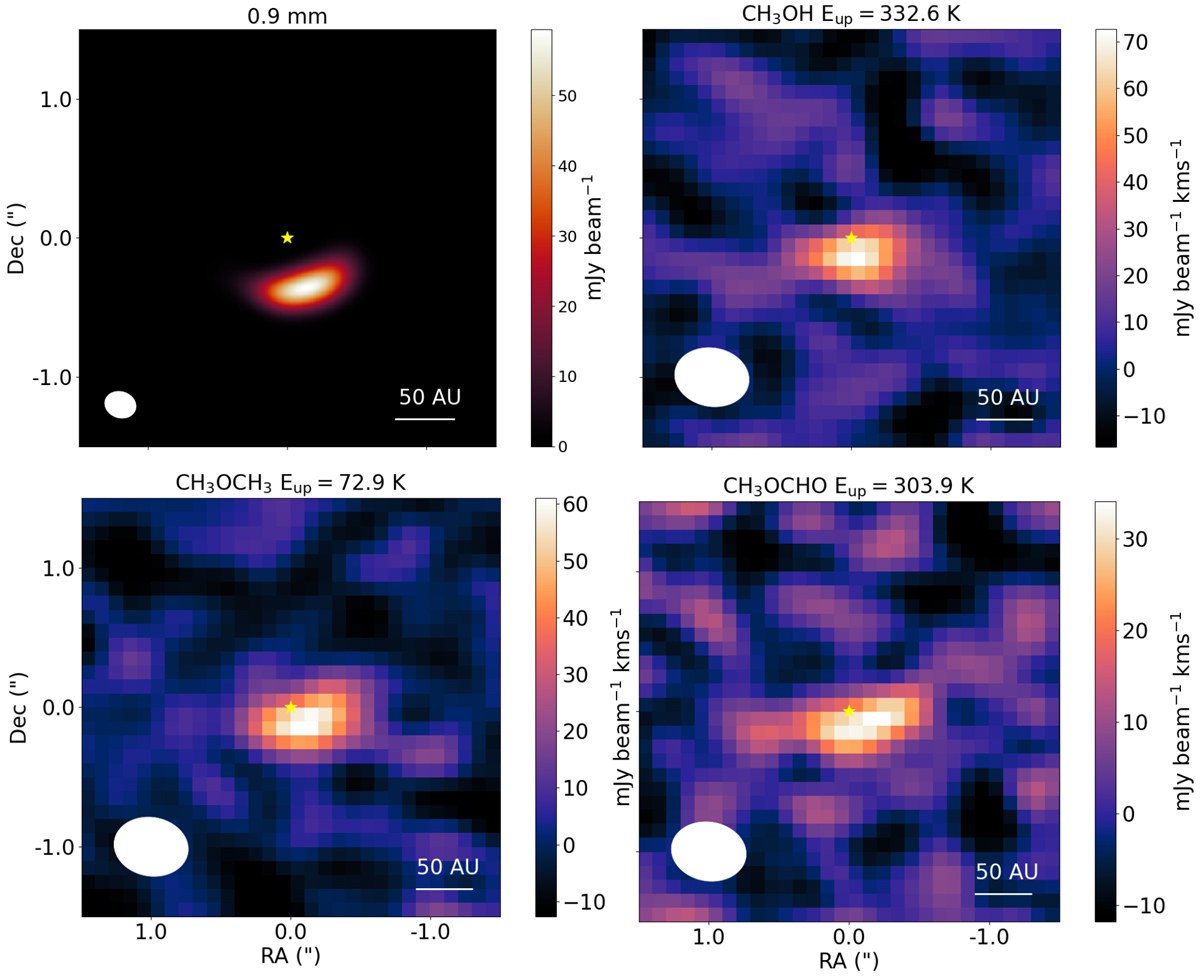
Integrated intensity maps of the 0.9 mm continuum emission and a subset of the detected molecular lines listed in Table A.1. Top right: CH3OH 161,15 –160,16. Bottom left: CH3OCH3 113,8 –102,9, and bottom right: CH3OCHO 322,30 –322,29 and 323,30–323,29 blend. The beam is shown in the bottom left corner and a scale bar is shown in the bottom right corner.
Current usage metrics show cumulative count of Article Views (full-text article views including HTML views, PDF and ePub downloads, according to the available data) and Abstracts Views on Vision4Press platform.
Data correspond to usage on the plateform after 2015. The current usage metrics is available 48-96 hours after online publication and is updated daily on week days.
Initial download of the metrics may take a while.